REportal 2.0
 REportal1 is a central repository for reverse engineering tools. It contains a compresensive set of reverse engineering tools to profile and data mine source code and software systems.
REportal was re-architected to provide a Service-Oriented Architecture (SOA) above useful reverse engineering and software source/architecture visualization tools such as Chava, Ciao, and Bunch.
REportal works by exposing platform-specific tools as a web service interface, that then wraps the underlying API or command line interface of the tool itself. These tools are then integrated in a contextual way through the web portal: for example, a visualization of a software system’s class architecture can be linked to a source browser, or to source code metrics; these tools are configured to operate on the user’s project automatically, providing a consistent interface to the user. REportal featured the following services:
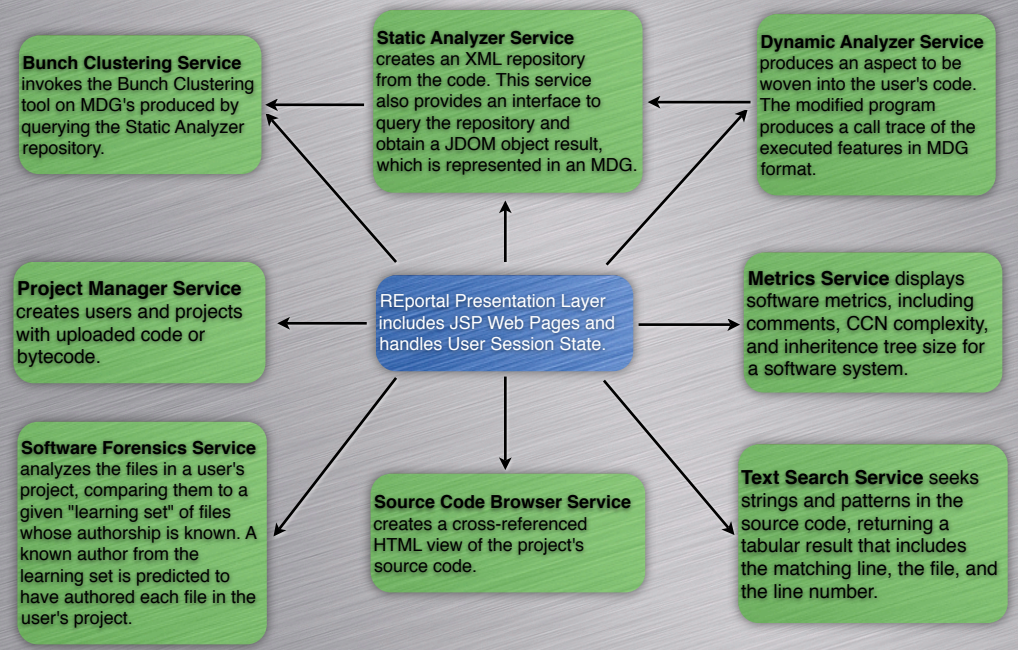
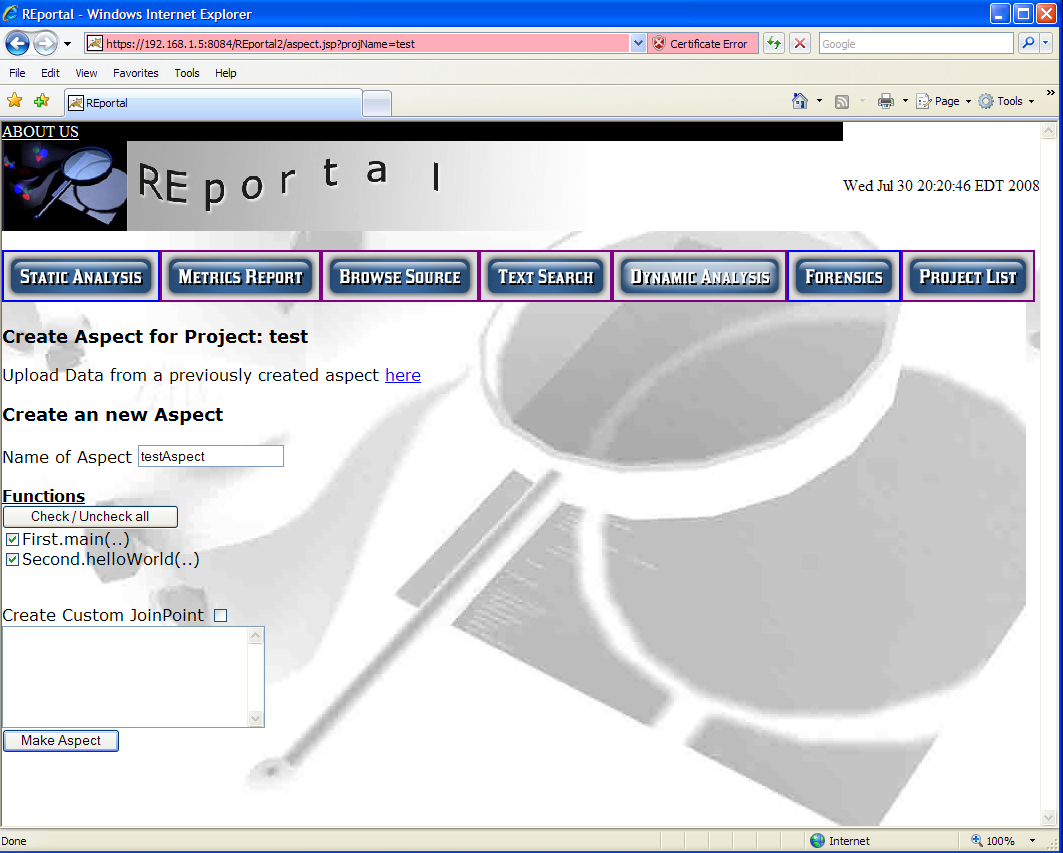
Many of these tools provide static anslysis services; however, dynamic analysis was also provided through the automatic generation of Aspects. Aspects were chosen by the user and then automatically compiled into the user’s software system. The user could then execute the software and provide REportal with the Aspect report output for visualization.
A summary of the major features enabled by REportal is given below. Click here for a description of each of the features of REportal.
Information about the development of the portal can be found in my Masters Thesis and in this paper describing the architecture.
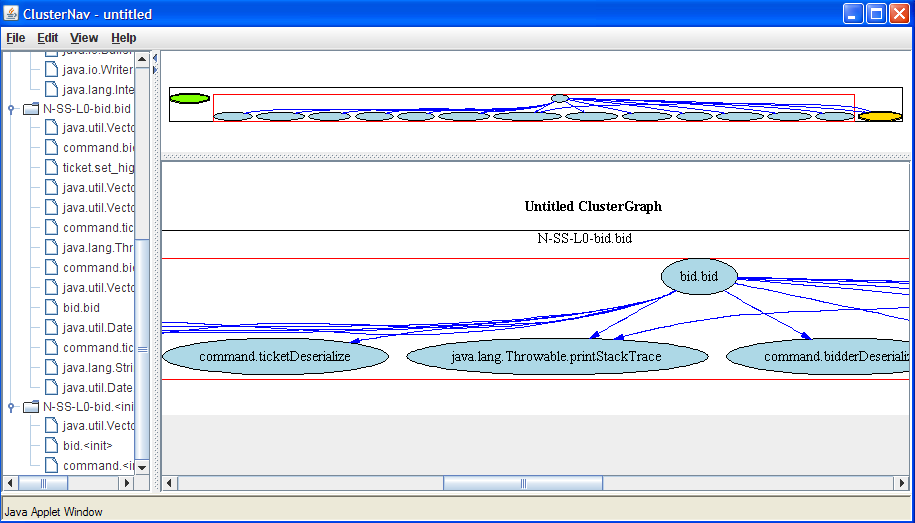
I also developed auxiliary tools for visualization of software architecture, including ClusterNav for visualization of Bunch clustered Module Dependency Graphs (MDG), and xml2dot for visualization of xml graph structures.
ClusterNav was integrated into REportal, enabling automatic expansion and collapse of the computed software architecture clusters. Clusters (octagons) can be expanded into their rectangular groups of artifacts, and are color-coded according to their relative weight.
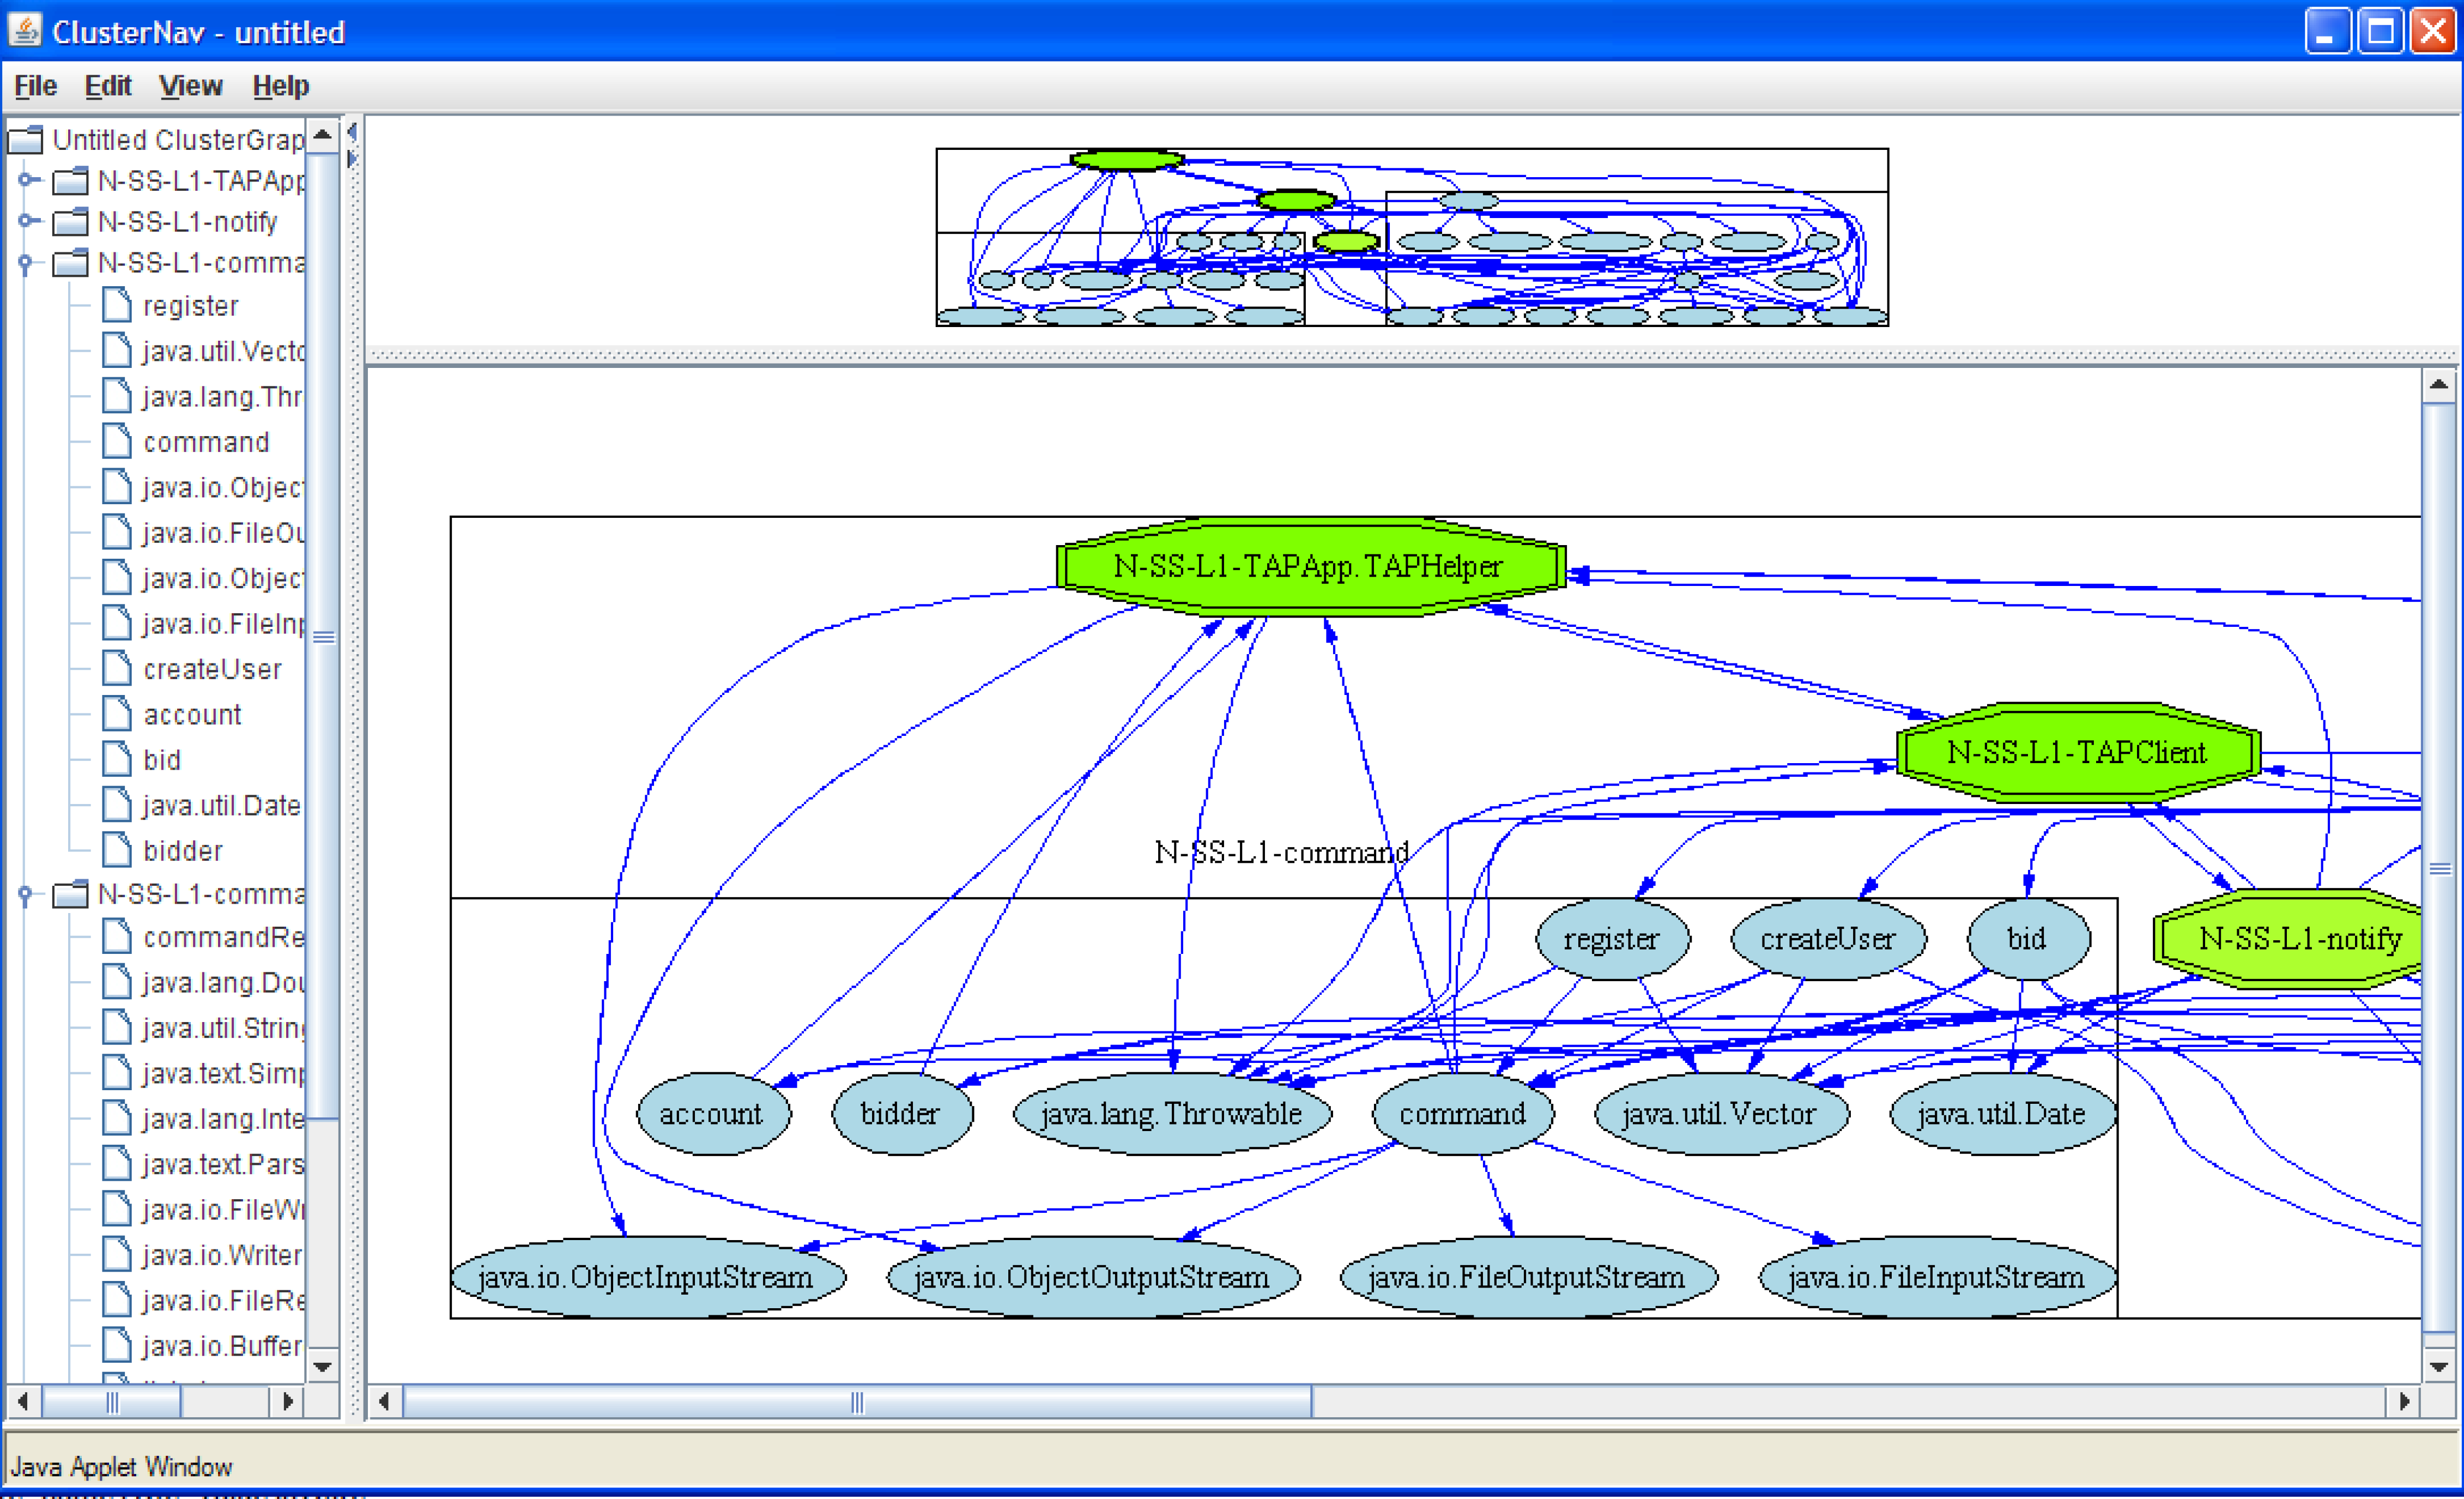
These MDG visualizations can be filtered in interesting ways; for example, by generating a reachability query that shows the transitive “reach” of a particular software module, including function invocations or variable usage.
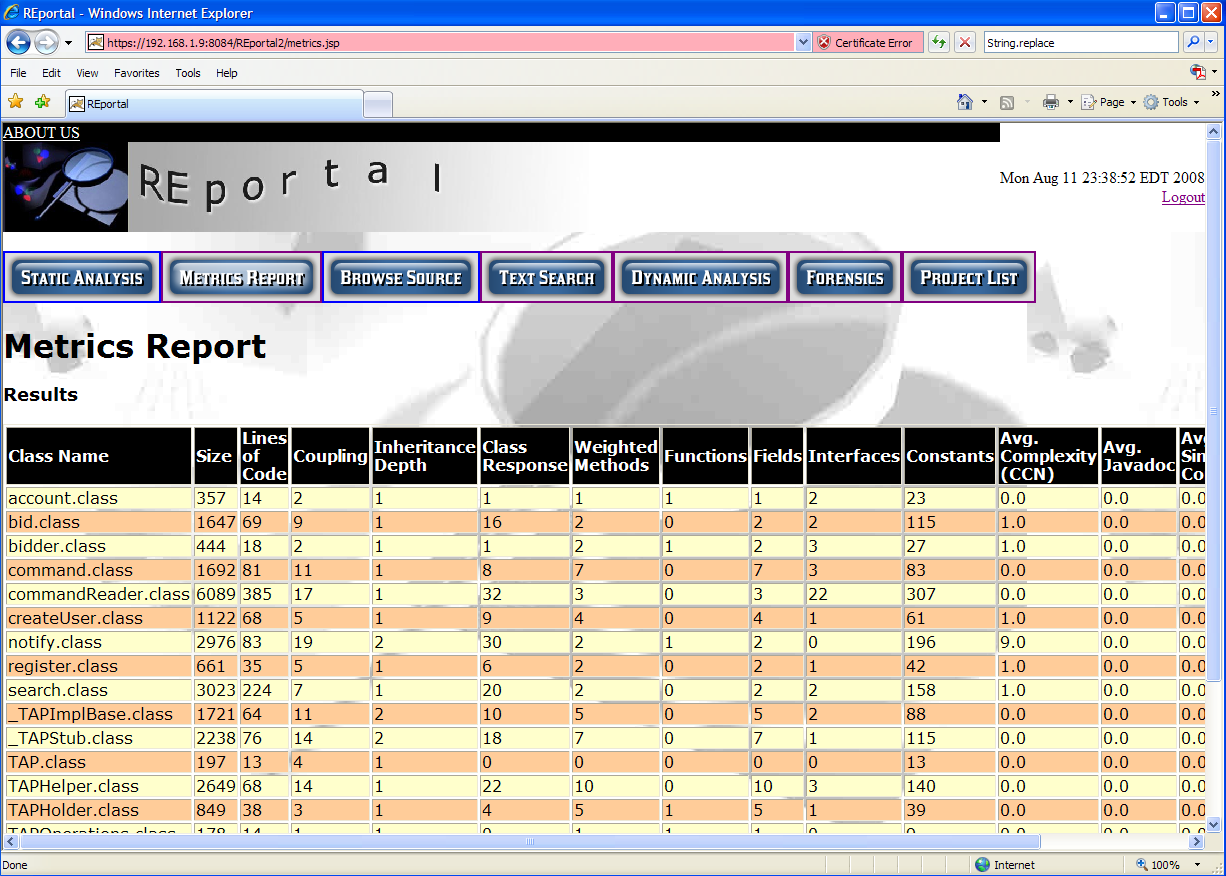
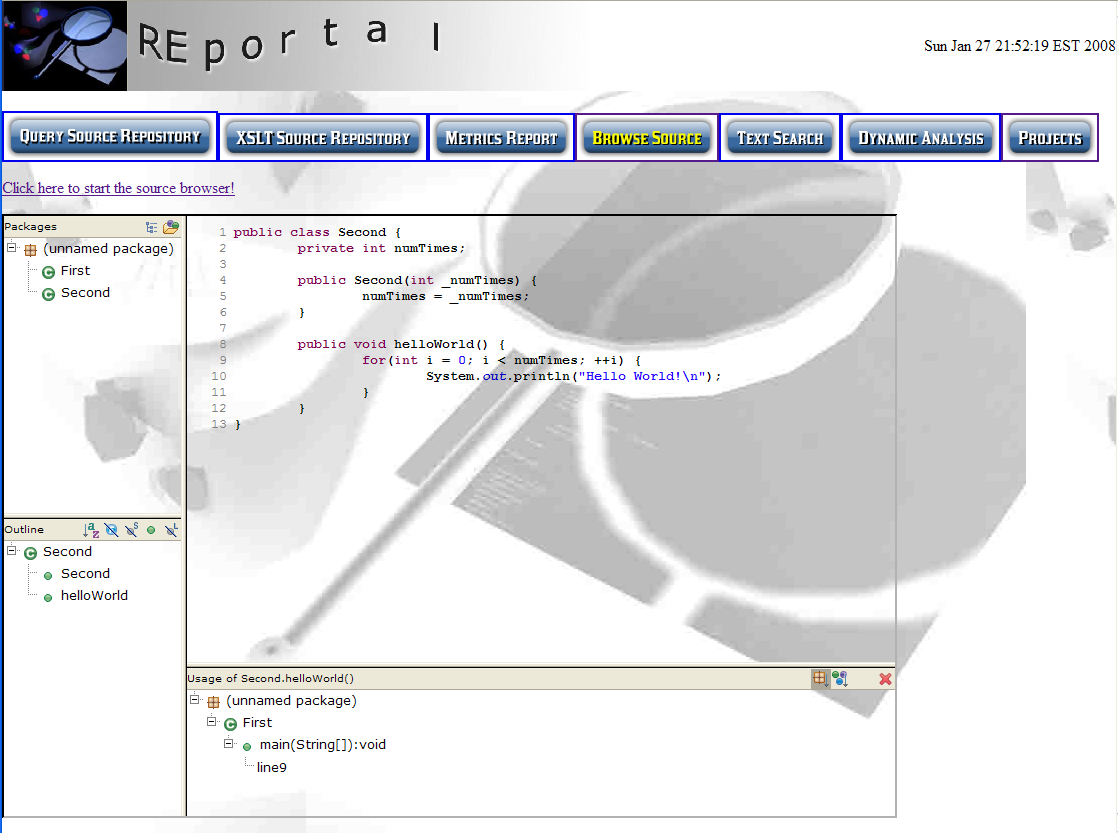
Static reports such as code quality metrics and a hyperlinked source browser are also available.
Publications
A Service-Based Web Portal for Integrated Reverse Engineering and Program Comprehension
Mongan, William M. (2008). A Service-Based Web Portal for Integrated Reverse Engineering and Program Comprehension. MS Thesis, Drexel University.
Re-engineering a Reverse Engineering Portal to a Distributed SOA
William M. Mongan, Maxim Shevertalov, Spiros Mancoridis. Re-engineering a Reverse Engineering Portal to a Distributed SOA. IEEE Proceedings of the 16th International Conference on Program Comprehension (ICPC) 2008.
Talks
A Service-Based Web Portal for Integrated Reverse Engineering and Program Comprehension
Talk at Drexel University, Philadelphia, PA
Re-engineering a Reverse Engineering Portal to a Distributed SOA
talk at IEEE Proceedings of the 16th International Conference on Program Comprehension (ICPC), Amsterdam, Netherlands
REportal: A Web-Based Reverse Engineering Portal
talk at REportal: A Web-Based Reverse Engineering Portal. Drexel University Research Day, Philadelphia, PA
The REportal hosted instance at Drexel (http://reportal.cs.drexel.edu) may be reachable only by the Drexel community, or may be in a retired state, as I am no longer maintaining this deployment following my departure from the university. Please feel free to contact me to request access or for the code base. ↩
