Web and Mobile Development: COVID Plot.ly Browser Client (100 Points)
Assignment Goals
The goals of this assignment are:- To invoke a RESTful web service using the web browser
- To use JavaScript to manipulate web page elements dynamically
The Assignment
If (and only if) you are using GitHub to submit, you can clone this assignment from GitHub Classroom at https://classroom.github.com/a/ZLKU7ftG. Otherwise, you may skip this step!In this lab, you will use the plot.ly service to generate a graphical plot that will be fed back to your browser as an image, as if you had loaded it statically from a web server. Specifically, we will download current COVID positivity data across the United States to generate the graph.
Step 1: A plot.ly Tutorial
First, deploy this tutorial in repl.it to test out the plot.ly service. You can save your file as a html webpage, uncomment the HTML code, and place the provided JavaScript where specified inside the <script> tag. When you open the webpage, you should see a sample plot with two traces. Inspect the JavaScript source code, specifically:
- What makes plot.ly generate a bar chart here?
- How did the plot “know” to render in the
plotly-divHTMLdivelement? - Add a different animal to one or both of the traces, with a value of your choice.
Step 2: Downloading COVID Data
In the <script> section, make an HTTP GET request to the COVID Tracking API. For now, you can console.log() the text returned, so that it prints to the browser console window. Specifically, you will use this endpoint: https://api.covidtracking.com/v1/states/daily.json.
You can try out this API from the console using curl as follows (this example filters out only those objects whose state is PA):
curl --silent 'https://api.covidtracking.com/v1/states/daily.json' | jq '.[] | select(.state == "PA")'
Create two arrays for your plot: the date and the positive field (for the count of positive cases on that date). For simplicity, only add those records whose state is a particular state, like PA. You can obtain a JSON object (an array that you can iterate) as follows: var responseObj = JSON.parse(xhttp.responseText);.
Note that plot.ly expects dates to be in the form yyyy-mm-dd, while this data reports the date in yyyymmdd format. Using the str.substring method, convert your date to the proper format. You can read the date and convert it to a string like this:
var dt = row['date'].toString(10);
dt = dt.substring(0, 4) + "-" + dt.substring(4, 6) + "-" + dt.substring(6, 8);
Step 3: Plotting COVID Data
Name your two arrays xarr and yarr for your dates and positive test counts, respectively. You can use the following layout to plot your values in plot.ly. Feel free to create your own layout; however, I have provided this one here so that you do not have to manually configure all the settings. Visit this page to get the current time in milliseconds since the epoch, which you can use to populate your x-axis range variable to plot to the current date.
trace = {
    uid: 'abc123',
    line: {
      color: 'rgb(255, 127, 14)',
      shape: 'spline',
      width: 3
    },
    mode: 'lines',
    name: "PA COVID Positives",
    type: 'scatter',
    x: xarr,
    y: yarr
};

layout = {
  title: 'COVID Daily Positives',
  width: 1024,
  xaxis: {
    type: 'date',
    title: 'Date',
    range: [1583020800000, 1598918400000], // 3/1/2020 to 9/1/2020 in epoch milliseconds (https://www.epochconverter.com/); change these to your desired date - for example, you can change the second parameter to the current time in milliseconds from the epoch by visiting here (https://currentmillis.com/)
    showgrid: false,
    autorange: false,
    tickformat: ''
  },
  yaxis: {
    type: 'linear',
    title: 'Count',
    autorange: false,
    range: [0, 300000],
    gridcolor: 'rgb(208, 208, 208)',
    ticksuffix: '  '
  },
  height: 768,
  legend: {
    x: -0.24796901053454015,
    y: 0.9713068181818182,
    bgcolor: 'rgba(242, 242, 242, 0)',
    traceorder: 'reversed'
  },
  autosize: false,
  annotations: [
    {
      ax: -246,
      ay: -164,
      font: {
        size: 14,
        color: 'rgb(129, 129, 126)'
      },
      text: 'Count',
      arrowcolor: 'rgba(68, 68, 68, 0)'
    }
  ],
  plot_bgcolor: 'rgb(242, 242, 242)',
  paper_bgcolor: 'rgb(242, 242, 242)'
};

data = [trace];

Plotly.plot('plotly-div', {
  data: data,
  layout: layout
});
Extra Credit 1 (10 Points): Choropleth Graph
Finally, create a Choropleth Graph that shades the states according to their most recent total case counts. Notice that the example loads a csv file of data; however, you can continue to generate the data arrays as you have done before. locations is an array of two-letter state codes, and z is a parallel array of the value you’re plotting.
Generating a Choropleth Graph using CSV Data
You may have noticed that the example code can load a CSV file directly. Modify that initial example to load this CSV to plot total cases by state.
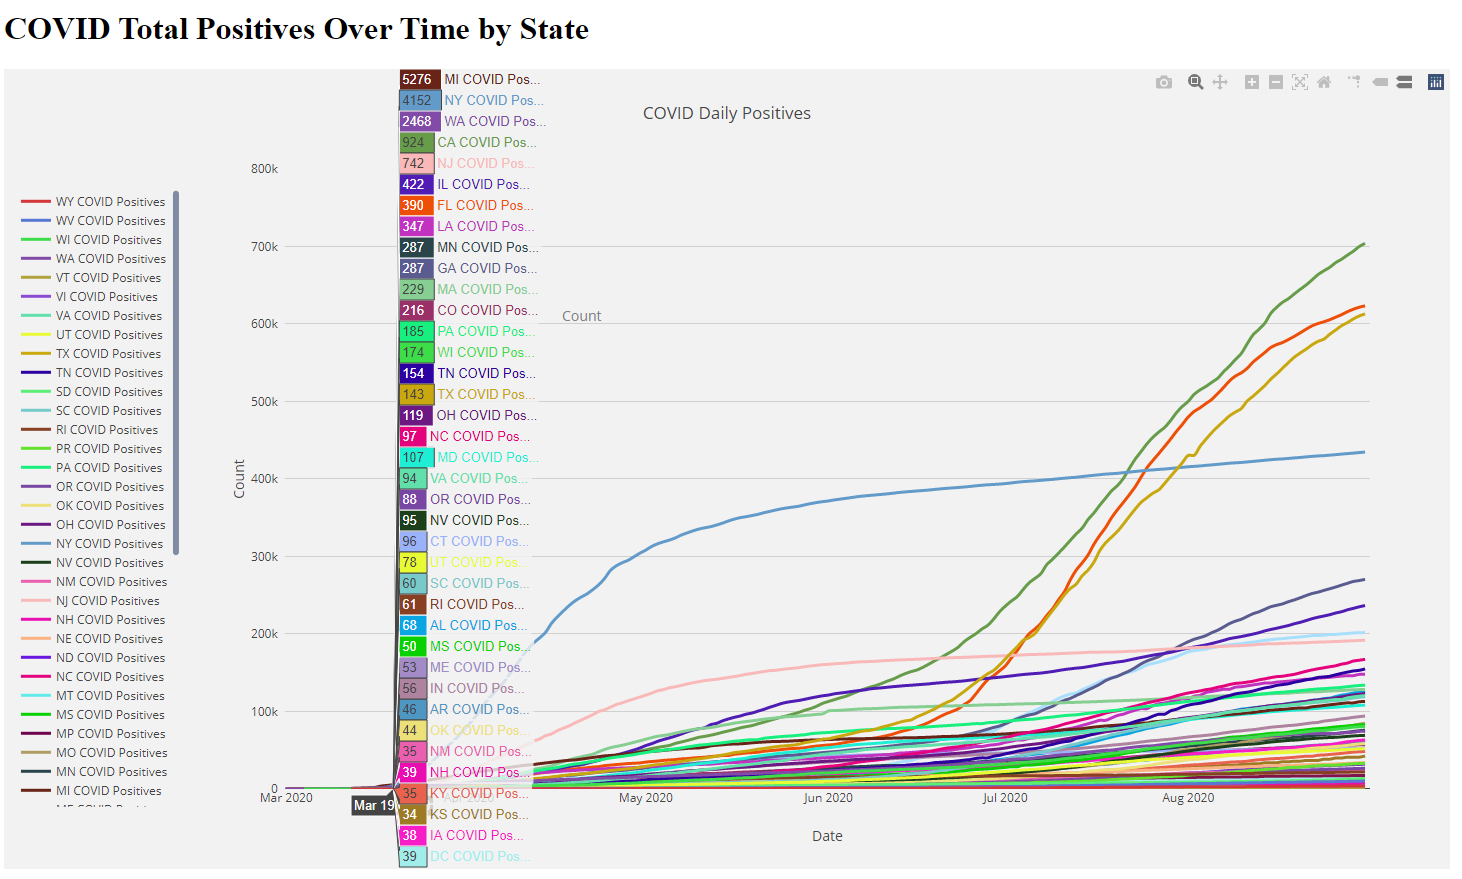
Extra Credit 2 (10 Points): Modify Step 3 for All States
Create a dictionary of xarr and yarr arrays, with the state as the key. Notice that the data variable in Step 3 is actually an array of traces. Append all count data to that appropriate state key array, and then create an array of trace dictionaries, which you will push to the data array. You can comment out the data = [trace]; line in Step 3, since you’ll be creating it yourself. Now, you’ll have every state plotted together. An example is provided below, along with a reference regarding using arrays and dictionary structures in JavaScript.
var dict = {};
dict['key'] = 'value';
dict['arr'] = [];         // you can append to this
dict['arr'].push(5);      // like any other array!
dict['key']['arr1'] = []; // here is another one
dict['key']['arr2'] = []; // and another one

for(var key in dict) { // you can iterate the dict!
    console.log(key + ": " + dict[key]);
}
Submission
If you wrote code as part of this assignment, please include a README in which you describe your design, approach, and implementation. Additionally, please answer any questions from the assignment, and include answers to the following questions:- If collaboration with a buddy was permitted, did you work with a buddy on this assignment? If so, who?
- Approximately how many hours it took you to finish this assignment (I will not judge you for this at all...I am simply using it to gauge if the assignments are too easy or hard)?
- Your overall impression of the assignment. Did you love it, hate it, or were you neutral? One word answers are fine, but if you have any suggestions for the future let me know.
- Any other concerns that you have. For instance, if you have a bug that you were unable to solve but you made progress, write that here. The more you articulate the problem the more partial credit you will receive (it is fine to leave this blank).
Assignment Rubric
| Description | Pre-Emerging (< 50%) | Beginning (50%) | Progressing (85%) | Proficient (100%) |
|---|---|---|---|---|
| Algorithm Implementation (50%) | The algorithm fails on the test inputs due to major issues, or the program fails to compile and/or run | The algorithm fails on the test inputs due to one or more minor issues | The algorithm is implemented to solve the problem correctly according to given test inputs, but would fail if executed in a general case due to a minor issue or omission in the algorithm design or implementation | A reasonable algorithm is implemented to solve the problem which correctly solves the problem according to the given test inputs, and would be reasonably expected to solve the problem in the general case |
| Code Quality and Documentation (40%) | Code commenting and structure are absent, or code structure departs significantly from best practice, and/or the code departs significantly from the style guide | Code commenting and structure is limited in ways that reduce the readability of the program, and/or there are minor departures from the style guide | Code documentation is present that re-states the explicit code definitions, and/or code is written that mostly adheres to the style guide | Code is documented at non-trivial points in a manner that enhances the readability of the program, and code is written according to the style guide |
| Writeup and Submission (10%) | An incomplete submission is provided | The program is submitted, but not according to the directions in one or more ways (for example, because it is lacking a readme writeup) | The program is submitted according to the directions with a minor omission or correction needed | The program is submitted according to the directions, including a readme writeup describing the solution |