CS173: Intro to Computer Science - Debugging in the NetBeans Software Environment
Create a Project
First, create a project as you normally would. I’ve pre-populated some code with a bug in it.
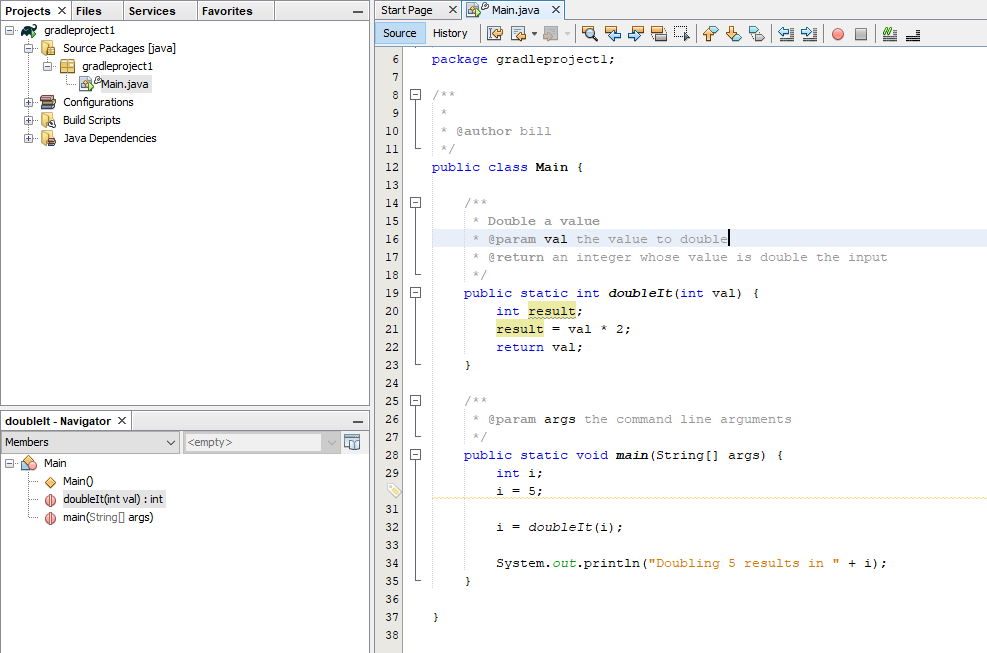
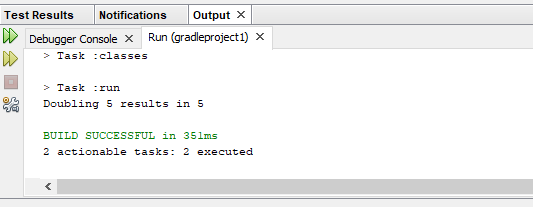
We can see that the output is incorrect. I’ve tried to double the value 5, and this resulted in 5 instead of 10! Let’s systematically track this bug.
Unit Testing
If you have already been provided with code that has a known bug in it, you can skip directly to the “Using the Debugger” Step
Although not specifically required for debugging, it’s a good practice to create test cases to expose bugs. Even if our output above was correct, we might have bugs that would cause our code to fail on other inputs. It’s a great idea to create a series of test cases that test a variety of values. It’s impossible to test every conceivable value, but “boundary cases” are often a good place to start (negative numbers, positive numbers, 1, -1, 0, very large numbers, very small numbers, and so on).
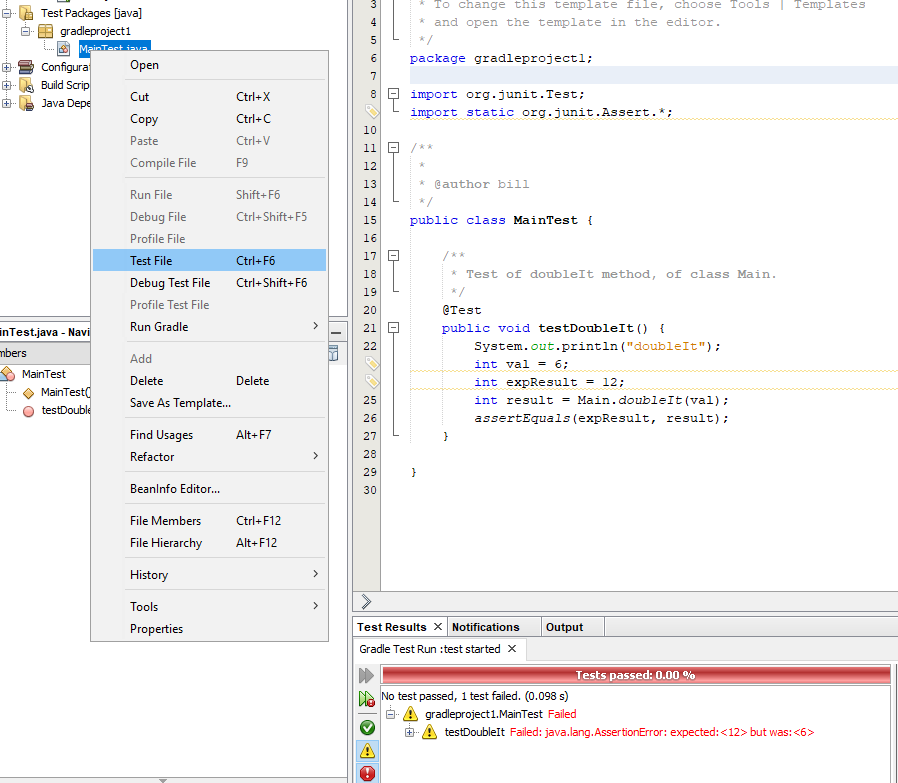
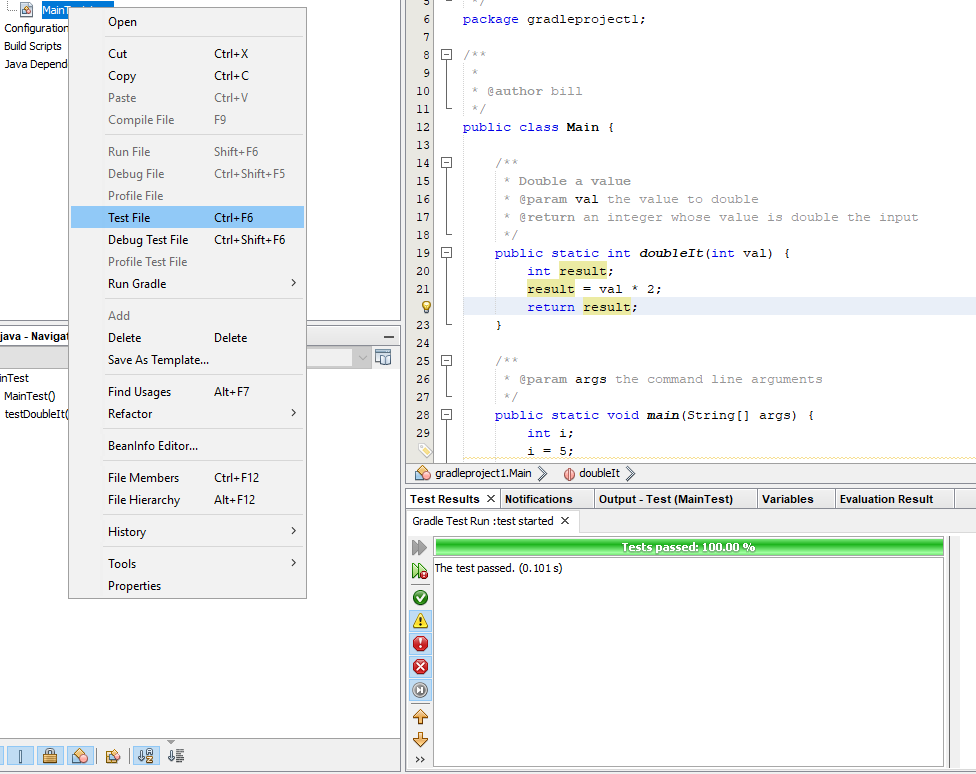
Let’s use NetBeans to create a unit test class that we can use to populate our tests. For this example, we’ll just create a single test case, so that things fit neatly into the screenshot.
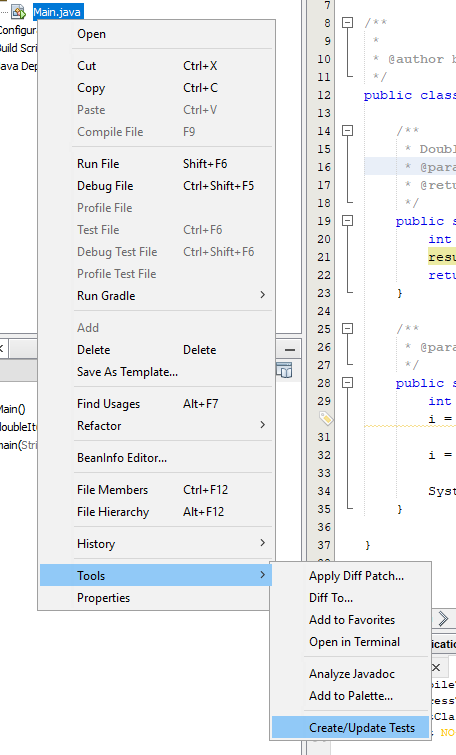
Right-clicking on the test class file and clicking Test File will cause the test methods inside to execute. Notice that our test method is annotated with @Test. You could create more of these by adding additional methods. Our test case is testing the value 6, which fails. Notice that the method returns 6 instead of 12, which is consistent with what we saw in our print statement earlier (but still incorrect).
A more detailed guide on unit testing is available here.
Note: You may need to replace your import lines, if you see the word jupiter in them. You can specify JUnit 4 in the Create/Update Tests window when you create your tests (it’s ok to re-create them if needed), and then delete the imports in your test file and replace them with these instead, if so:
import org.junit.Test;
import static org.junit.Assert.*;
Using the Debugger
Now that we have a failed test case, let’s create a Breakpoint that will cause our program to pause its execution at a certain point, and allow us to inspect our variables and the state of the program. This allows us to confirm at various parts of the program that things are executing the way we expect. Thus, we can use a Breakpoint to narrow down where in the code our program is failing.
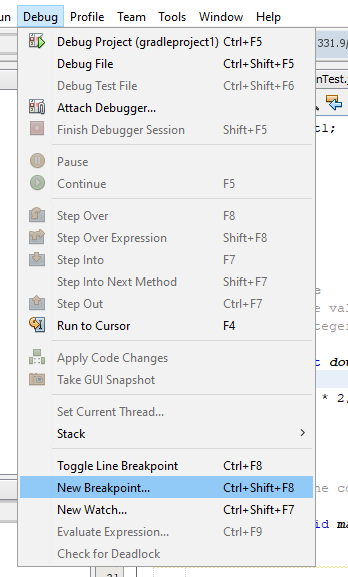
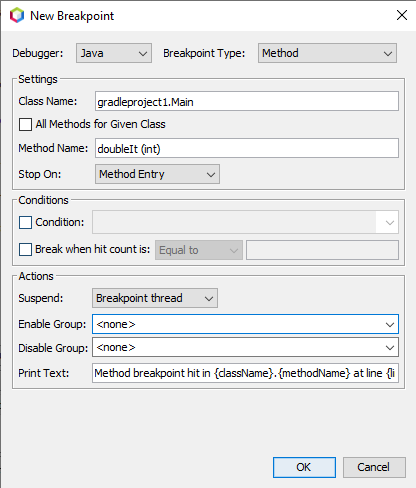
We’ll create a Method breakpoint, which pauses the program when a method is called, so we can execute the code in the method one line at a time. We could choose main as the method, in which case the program would pause for us as soon as it starts. Here, we’ll break at the doubleIt method. The Breakpoint Type box at the top right of this window allows you to select other types of breakpoints, including Field (a type of variable that we’ll explore later when we learn about Classes), and Line, which allows us to enter a line number from the program.
We’ll just create this one breakpoint, but you can repeat this menu to create several of these, as you wish.
The red triangle where the line number used to be indicates that a breakpoint has been placed here.
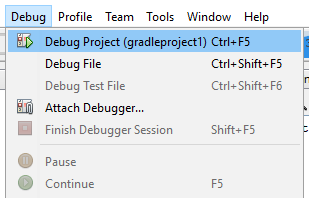
To run the program with the debugger on (that is, to run the program but pause at the breakpoint we just created), click the Debug Project menu item under the Debug menu. There is also a toolbar button that looks like the menu icon for Debug next to the Run button.
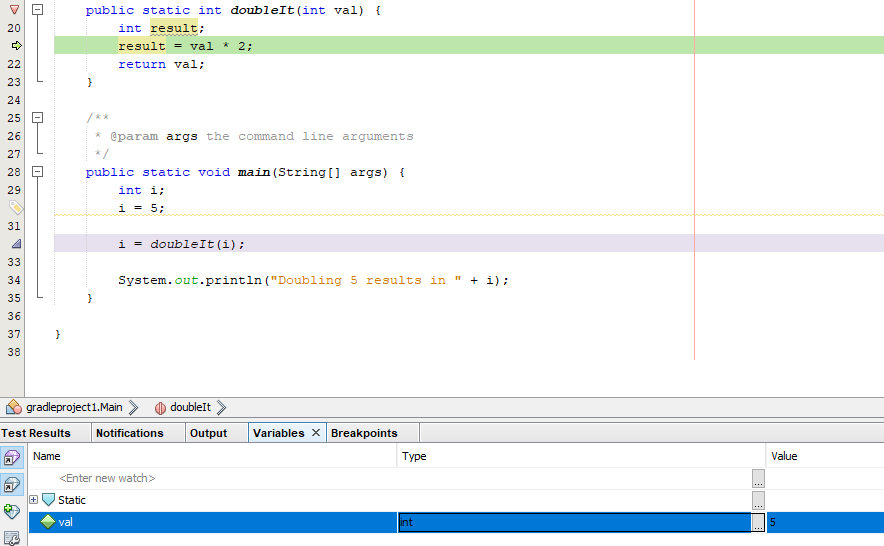
Notice the program pauses at the doubleIt method, and highlights in green the first statement of the program (at least the first statement in that menu that updates a value). The bottom window pane lists the variables in your program. The line highlighted in green hasn’t executed yet, it’s the position in the program indicating the next line to execute. So, for now we only see the val variable (the function parameter to doubleIt) in this pane. It correctly indicates the value 5, which it received from main.
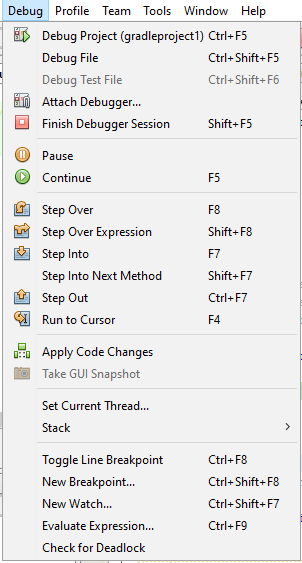
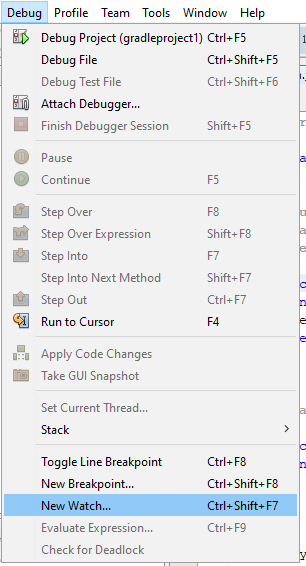
We have several options for how we wish to proceed from here. The Debug menu allows us to Pause (we are currently paused), Continue (which runs the program until the next breakpoint, or until the end if there are no more breakpoints), and a series of Step menu options. These include:
- Step Over: Run the next line of code only and then break. However, treat a function call as if it is a single line of code (that is, call the entire function without stepping through that function one line at a time).
- Step Into: Run the next line of code only and then break. If that line is a function call, drill into that function and begin stepping into the lines of code within that function.
- Step Out: Continue executing until the end of the current function, and then break again.
- Run to Cursor: You can set your own new breakpoint on-the-fly, by placing your cursor somewhere in the program and selecting this option. The debugger will run through the code until reaching this point, and then break again.
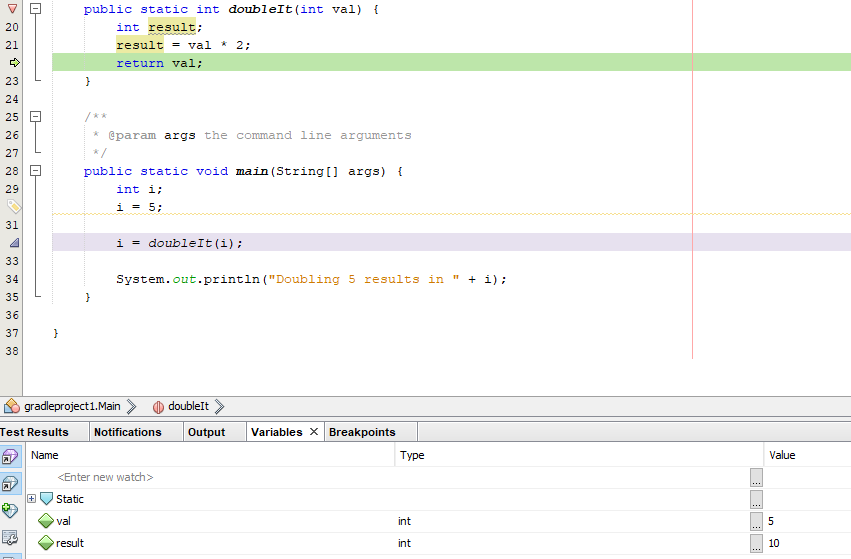
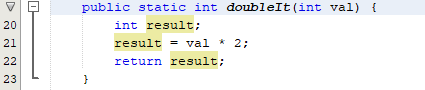
Here is the result of choosing Step Into. In this case, because the line I executed (result = val * 2;) is not a function call, Step Into would be exactly the same as choosing Step Over in this case. Notice the variable values in the bottom pane of the window. The variable result has correctly taken on val * 2 or 10.
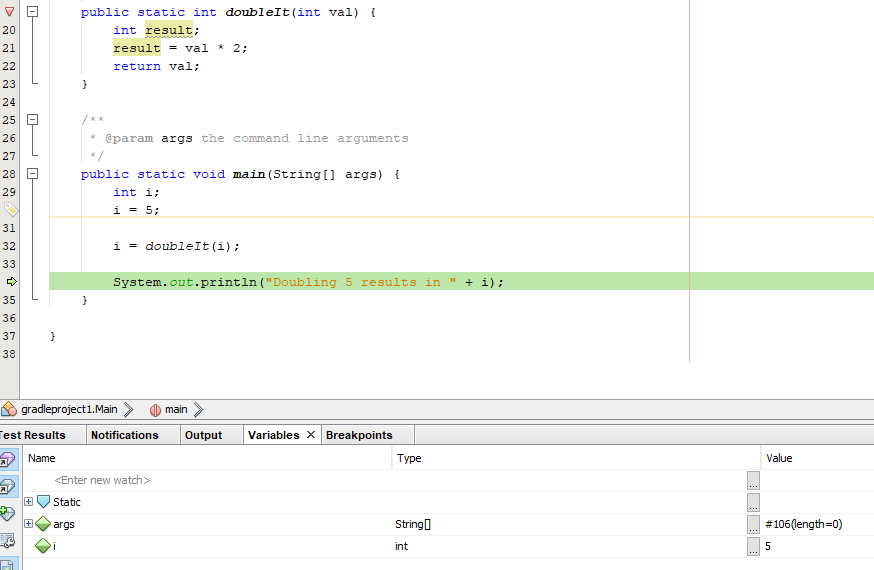
Choosing Step Into again, the last line of the doubleIt function executes, and I return to main. The debugger breaks here again, since Step Into executes only one line of code at a time.
Notice the value i, which would have been assigned the return value of doubleIt, is still 5 and not 10, even though our result value was 10 while we were debugging that function! Our mistake is likely to manifest itself after computing val * 2 and the return statement. Sure enough, we returned val instead of result!
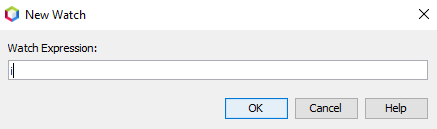
The variables in the bottom pane disappear when they go “out of scope” - for example, when the function in which they’re declared returns. We can permanently list the value of a variable by adding a Watch.
Here, we’ll watch the variable i so that its current value is always displayed by the debugger while we step through it. You can create as many of these as you wish.
Sometimes, you’ll create multiple breakpoints, but only wish to break at some of them during a particular run, while you narrow down your bug. You can disable a breakpoint by right-clicking on the red triangle where the line number of the breakpoint would normally be, and clicking Enabled under the Breakpoint context menu. This will toggle the breakpoint to a disabled state. You can repeat this process to re-enable it.
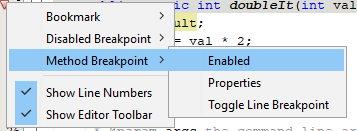
Notice the red triangle becomes a grey triangle when the corresponding breakpoint is disabled.
Now that we are returning result from doubleIt, let’s run our test case again. Now, we’ve passed!
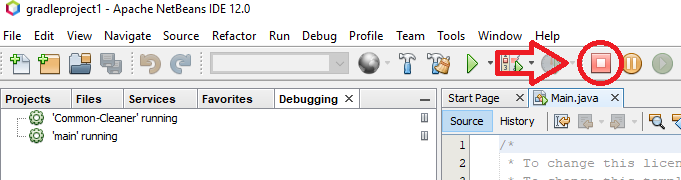
Sometimes, you may find that you wish to stop the debugger and start over from the beginning. To do this, click the red “stop” toolbar icon shown below, and then you can start the Debugger using the Debug menu like before!