CS173: Intro to Computer Science - The Iris Dataset (100 Points)
Assignment Goals
The goals of this assignment are:- To use File I/O to read and process a text file dataset
- To use arrays to process records of data
- To apply mathematical concepts in an algorithm
- To tokenize string data using the split() function
Background Reading and References
Please refer to the following readings and examples offering templates to help get you started:The Assignment
The Iris Flower Dataset is a classic dataset proposed by R. A. Fisher to demonstrate the use of the Fisher Linear Discriminant, which is a classic instrument to separate and classify data.
In this assignment, you will read the classic Iris dataset, and use information obtained about different types of flowers to predict what kind of flower an unknown specimen is knowing only its measured data values.
Here are examples of the three flowers, taken from the Iris Flower Dataset Wikipedia page:
| Setosa | Versicolor | Virginica |
|---|---|---|
 |
|
 |
The dataset can be downloaded and saved into your project directory. On the Iris download page, click the Data Folder link, and then download the iris.data file. The format of this file is a Comma Separated Value (CSV) file, meaning that each token on a line is separated by a comma character (as opposed to spaces which we used earlier). This particular CSV does not have a header, so even the first row of data is an actual data record. The format of the file is as follows:
SepalLength,SepalWidth,PetalLength,PetalWidth,SpeciesClassification
The lengths and widths are numeric values, and the classification is either setosa, versicolor, or virginica. Given the sepal and petal widths and lengths, we can make a prediction about new types of flowers whose classification is unknown to us. Generally, the more examples we have of each type of flower, the more accurate our prediction will be.
Here is a sample of the data, taken from http://archive.ics.uci.edu/ml/machine-learning-databases/iris/iris.data:
5.1,3.5,1.4,0.2,Iris-setosa
4.9,3.0,1.4,0.2,Iris-setosa
4.7,3.2,1.3,0.2,Iris-setosa
4.6,3.1,1.5,0.2,Iris-setosa
5.0,3.6,1.4,0.2,Iris-setosa
Before we begin, open the CSV file in your favorite spreadsheet program. You’ll see four numeric columns and a classification, as you saw above. Plot any two of the numeric columns on a scatterplot graph. What do you notice? Here is an example of such a plot comparing the Sepal Width vs the Sepal Length, taken from scikit-learn:
Notice that some points are clearly off to the left from the other two groups, while two groups are intermixed along the bottom right of the graph. That’s because the sepal width and sepal length does not perfectly separate our species of flowers into unique clusters. If we add a third dimension to our graph by adding, say, the petal length (or even add more dimensions: arrays can have dimensions beyond what we can visualize!), we might be able to separate those points even further. If the clusters of data are far apart, we can guess which cluster a new, unknown data point belongs to, by measuing how far it is from the center of each cluster and inferring that it belongs to the nearest center. In this assignment, we will write a program to compute centroids of three species (virginica, versicolor, and setosa flowers) over four dimensions (sepal length, sepal width, petal length, and petal width), and compute the nearest of these three 4-D centroids to a flower whose species we do not know but whose petal and sepal length and width we can measure!
Step 1: Reading the CSV File
Open the CSV file for reading. Since it is a CSV file, a Scanner is a good choice, as we can read the text line-by-line. Using the split function, you can obtain an array of values for each row. This array will contain the sepal length, sepal width, petal length, petal width, and the known classification of that particular flower. The split function accepts a String parameter representing the delimiter character on which to split. For a CSV, that’s the comma character. Read the text file into an ArrayList<String>, in which each array element is a line from the file, and return that ArrayList.
Download and save the iris.data file into your project directory under a data subdirectory, and verify that you can read the CSV file, comma separate each line of the array you get back in a loop, and print the array values to the screen as a test. The filePath that you pass to readCSV will be "data/iris.data". Hint: you do not have to modify the commaSeparate or readCSV functions to do this, and you should not! Rather, call each of these functions from main() instead.
Step 2: Processing the Input and Separating Each Row of Values into Separate Arrays Based on their Species and Column
Now, you will use the ArrayList that you generated by reading the CSV file, comma-separate (or “tokenize”) each line in a loop into an array of tokens; in the loop (but after you tokenize each line), you will gather the sepal length, sepal width, petal length, petal width, and species from the array of tokens.
Additionally, recall that the String.split() function will separate a String into an array of individual String values separated by a delimiter parameter that you can provide. Refer to the Javadoc for a refresher!
If the species is a setosa flower, store the petal length into an array made just for setosa flower petal lengths. Similarly, use separate arrays for the versicolor and virginica flowers as well. By the time you are finished reading the text file, you should have an array containing all the setosa petal lengths, one for all the setosa petal widths, and so on. You will have created 12 arrays of Double values:
- an array containing the sepal lengths of
Iris-setosaflowers - an array containing the sepal lengths of
Iris-versicolorflowers - an array containing the sepal lengths of
Iris-virginicaflowers - an array containing the sepal widths of
Iris-setosaflowers - an array containing the sepal widths of
Iris-versicolorflowers - an array containing the sepal widths of
Iris-virginicaflowers - an array containing the petal lengths of
Iris-setosaflowers - an array containing the petal lengths of
Iris-versicolorflowers - an array containing the petal lengths of
Iris-virginicaflowers - an array containing the petal widths of
Iris-setosaflowers - an array containing the petal widths of
Iris-versicolorflowers - an array containing the petal widths of
Iris-virginicaflowers
Hint: you might optionally consider making an array of these 12 arrays when you first create them, so that you can call your mean function in a very simple loop (and avoid having to paste the function call 12 different times!).
Each of these columns will always be in the same position, so to obtain the SepalLength value of a given line, it will always be the same index of the array returned by commaSeparate. Specifically, given the example file columns and values given above, what array index will contain the SepalLength, SepalWidth, PetalLength, PetalWidth, and SpeciesClassification from your “tokenized” array?
Note that these arrays contain Double values, even though your tokens array is of Strings. You can convert each String (that contains text representing a number) to its true numeric value using the Double.parseDouble() function (example below). Note that you should not convert textual (non-numeric) String values! So, if a String contains the species, like Iris-setosa, that should be read into a String and not converted to a Double; rather, the lengths and widths should!
// For example, if str contains "3.14", then val will be the Double 3.14
Double val = Double.parseDouble(str);
In summary, loop over your array of lines and comma separate (“tokenize”) each one in a loop. In the same loop, decide what species of flower you have. One of the values of your tokenized line array will contain the species (the same index each time!). You can use the String.equals() method on the tokens array element corresponding to the flower species to determine if your species equals Iris-setosa, Iris-versicolor, or Iris-virginica. Use an if statement to figure out which one! Finally, put each of the four numeric values into each of four arrays corresponding to its value (the sepal length, sepal width, petal length, or petal width). As a reminder, you will know which value is which because they’ll always be in the same order, and so they will have the same array index each time. For example, the sepal length will always be index [0]. Your if statement will show you which of the three sets of 4 arrays you’re inserting into during this iteration of the loop (the set corresponding to the setosa flower, the virginica flower, or the versicolor flower).
Step 3: Obtaining the Features: the Mean of the Sepal and Petal Length and Width of Each Species
Write a function that computes the mean of an array of double values or an ArrayList<Double> (whichever would be more convenient for you!). Use this function to compute the mean of these arrays. The formula for the mean is provided for your convenience:
Mean (\(\mu\)): \(\mu = \frac{\sum\limits_{i=1}^{n} x_{i}}{n}\)
When you have finished, you should have called this function 12 times on 12 different arrays, and obtained the mean of each of the 12 arrays you created in Step 2.
Step 4: Classifying a New Flower
Using the means you just computed, which we call our data features, we will try to determine the classification of an unknown flower, by comparing it to the examples we’ve just learned!
Make up values for a flower (any values you like!) based on the data that you see in the Iris data set. Try to choose values that you know should align with one classification of flower over the others (that is, choose values close to the bunch of values for a particular type of flower); this way, you can check your work. To classify our unknown flower, we will consider the means of our four original columns, separated into each of the three species: the sepal lengths, sepal widths, petal lengths, and petal widths as points in 4-dimensional space (one dimension for each of the four columns). Your unknown flower is also a point in 4-D space, and it is going to be closer to one of those mean points than it is to the others. I will call these points “centroids” - the center of the mean of the sepal length, sepal width, petal lenth, and petal width for a particular species. The centroid with the smallest distance to our unknown flower is going to be our prediction. From geometry, you may recall the Euclidean Distance as a measure of precisely this distance. Here is the formula:
Euclidean Distance: \(d = \sqrt{(x_{petalLength}-\mu_{petalLength})^{2} + (x_{petalWidth}-\mu_{petalWidth})^{2} + (x_{sepalLength}-\mu_{sepalLength})^{2} + (x_{sepalWidth}-\mu_{sepalWidth})^{2}}\)
Where \(\mu\) represents one of the means of a particular feature (such as the petalWidth) for a particular flower (such as the versicolor) that you computed in Step 3.
Because you will be computing several of these distance measurements, begin by writing a function that computes the Euclidean Distance. This function will accept your unknown flower sepalLength, sepalWidth, petalLength, and petalWidth, as well as the mean of one species’ sepalLength, sepalWidth, petalLength, and petalWidth that you computed in Step 3. Hint: you don’t have to pass all 12 means here! We will call this function three times, each time passing it four of the means corresponding to one of the species (for example, just the four virginica means, or just the four setosa means). That’s because we will compare the three Euclidean Distances (virginica, setosa, versicolor) that we get for our unknown flower, and predict that our unknown flower species is the one with the smallest of the three Euclidean Distances!
You will compute three of these Euclidean Distances: one using the means of the setosa flower, one using the means of the versicolor flower, and one using the means of the virginica flower. x is your made up flower that you’re looking to classify. So, for the first Euclidean Distance, when you consider the setosa flower, you should compute \(\mu_{petalLength}\), \(\mu_{petalWidth}\), \(\mu_{sepalLength}\), and \(\mu_{sepalWidth}\) as the means of those columns, but only for those rows that correspond to a setosa classification in the input data set. By doing this, we are “teaching” our algorithm about what a setosa flower “looks like” according to these data features. This is called “training” the algorithm. If we provide enough examples, and as long as the features that we compute from those examples (like the mean) differentiate one flower from another, we’ll be able to predict unknown flowers based on its own features by comparing them to the training features we’re computing now. In this case, that comparison is being made using the Euclidean Distance, which tells us how “close” or “far” an unknown flower is from the training features (in this case, the means) we observed.
Print out all three of your Euclidean Distances (one distance from your unknown flower to the centroid of the setosa flowers, one to the centroid of the versicolor flowers, and one to the centroid of the virginica flowers), and choose the flower corresponding to the smallest Euclidean Distance you calculated. That is your prediction. Read in values for the petal and sepal lengths and widths (as double values) from the user via the keyboard for a made up flower, and make the prediction!
Extra Credit (15 Points): Experimenting with the Data
Classifying the Input Samples
Iterate a second time over each line of the Iris Dataset CSV file (or over the ArrayList<String> that you generated by reading it the first time, if you still have that variable!). This time, pretend that you do not know the classification, and use those values as your “made up flower” to be classified. In your program, compare your classification to the actual classification from the CSV, and print out your accuracy rate.
Studying the Effect of More or Fewer Samples
What happens if you only read 10, 5, or 1 example of a setosa flower? Modify your program to read only the first N rows of each of the flower types. How well are you able to predict your flowers? Use the accuracy rate you computed above, and graph your accuracy over N=1, 5, 10, and the whole dataset.
Fisher Linear Discriminant
It is usually the case that adding more rows to our input data results in better classification (at least to a plateau). However, it’s not always the case that adding more columns (“features”) to the dataset makes for better prediction. If we use too many columns, our accuracy actually starts to decrease. If we needed to remove some columns, how would we choose which columns to keep and which to remove? Let’s find out which column(s) are helping us classify the data the best. We can do this by computing the Fisher Linear Discriminant (developed by Fisher, who also provided this classic Iris dataset).
The key idea behind Fisher’s Linear Discriminant is that data can be separated into classes if those classes have a relatively small variance, and the data between the classes have a relatively high variance. The variance is the average squared difference from the mean of a collection of data (we use the square of the difference so that the difference is always positive). It is computed as follows, and you should write a function to compute the variance of an array of data (note that the variance function uses the array mean, but you should already have a function to compute the mean of an array!):
Variance (\(\sigma^{2}\)): \(\sigma^{2} = \frac{\sum\limits_{i=1}^{n} ((x_{i}-\mu)^{2})}{n}\)
Imagine two different coins (for example, an American quarter and an American dime). The quarter has a large radius and weight compared to the dime. If you looked at enough quarters and dimes, each one might have a slightly different radius and weight because of wear and tear, but generally, they would be close together, but the radius and weight of each dime would differ greatly from those of the quarter. It is important to compute features that do not overlap between classifications. For our flower example here, our classification worked out because the petal and sepal lengths/widths were generally far apart between the different types of flowers (but also close together for each type of flower). As a result, comparing unknown flowers to the means of these features provided a reasonable prediction of the flower type. The Fisher LDA function gives us a mechanism to measure this feature “closeness” formally.
As you will learn in statistics, and implemented above in this assignment, the variance is a measure of the difference of the data elements to their overall mean. Therefore, Fisher’s idea can be expressed mathematically:
\(FisherLDA \propto \frac{(\mu_{1} - \mu_{2})^{2}}{\sigma_{1}^{2} + \sigma_{2}^{2}}\)
Recall that the mean is represented by (\(\mu\)), and the variance is represented by (\(\sigma^{2}\)).
The FisherLDA is large when the numerator is large and the denominator is small. That is, when the difference of the means is large, and the sum of the variances is small. This occurs when the means of the two classes differ greatly (like the dime and the quarter), while the variance of each is relatively small.
The Linear Discriminant function tells us how separable a feature is into two classes, and it only requires the mean and variance, which we have! For each feature (the original arrays of the lengths/widths from the data set that you created in Step 2), compute the Linear Discriminant function for the following features:
- The
setosasepal length vs theversicolorsepal length - The
setosasepal length vs thevirginiciasepal length - The
versicolorsepal length vs thevirginiciasepal length - The
setosasepal width vs theversicolorsepal width - The
setosasepal width vs thevirginiciasepal width - The
versicolorsepal width vs thevirginiciasepal width - The
setosapetal length vs theversicolorpetal length - The
setosapetal length vs thevirginiciapetal length - The
versicolorpetal length vs thevirginiciapetal length - The
setosapetal width vs theversicolorpetal width - The
setosapetal width vs thevirginiciapetal width - The
versicolorpetal width vs thevirginiciapetal width
At first glance, this seems like a lot of work! Before you start writing code, remember that you can do this once, but implement the code in a function that accepts the two arrays as parameters. Then, just call the functions with the right pair of arrays, and you’re done!
Here are a few questions to consider about the data:
- Which column/feature (i.e., the “sepal length”) best separates the
setosaand theversicolorflowers? - Which column best separates the
setosaand thevirginicaflowers? Which column seems the best overall? - Do any columns appear to do a poor job separating any of the classes?
- Which columns would you use for our approach?
- Based on your findings, which two flowers do you think are most easily distinguished between each other, and why?
Finally, remove the columns you selected based on the Linear Fisher Discriminant, and plot your new classification accuracies for N=1, 5, 10, and the whole dataset like you did in that part. Did you sacrifice any classification accuracy (and how much, if so) by removing one or more columns with relatively low LDA score?
Exporting your Project for Submission
When you’re done, write a README for your project, and save all your files, before exporting your project to ZIP. In your README, answer any bolded questions presented on this page. Here is a video tutorial describing how to write a README for your project, and how to export it.
Ethical Use of Learning Algorithms
Avoiding Discrimination
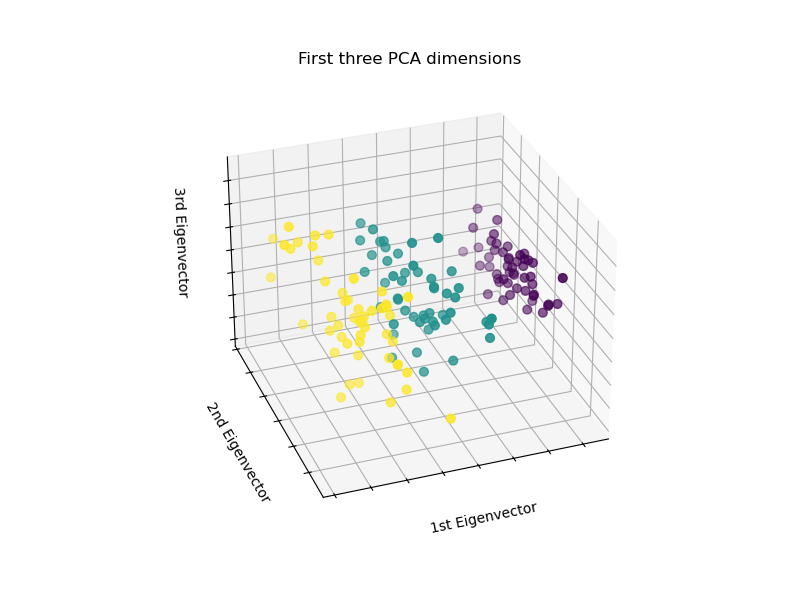
Generalizing features to a mean has the potential to bias an algorithm, either unintentionally or intentionally, toward making decisions that disadvantage people. This is known as Algorithmic Bias. This case study [1] describes a common scenario in which Principal Component Analysis (PCA) is applied to a dataset to determine which features best separate the data. PCA is another technique for selecting the best subset of column features to use in a learning algorithm (like we did here with the Fisher LDA score). In this example, the PCA algorithm was used to select features that are discriminatory. What steps can developers take to ensure that they are equitible when classifying data? In particular, what can be done to avoid developing algorithms that discriminate according to implicit bias or “blind spots?”
Publication in the Annals of Eugenics
Like other seminal statistical tools of the day (for example, the Student t-test), Fisher’s work was published in the Annals of Eugenics in 1936. Wiley Publishing includes a foreword to these articles as follows:
The articles published by the Annals of Eugenics (1925–1954) have been made available online as an historical archive intended for scholarly use. The work of eugenicists was often pervaded by prejudice against racial, ethnic and disabled groups. The online publication of this material for scholarly research purposes is not an endorsement of those views nor a promotion of eugenics in any way.
I endorse and echo this sentiment. We use these statistical techniques ubiquitously throughout science, mathematics, engineering, and computation. That ubiquity has the potential to obfuscate potentially harmful context and applications. We will discuss this in more detail in class, but for now, let us commit to applying these valuable techniques in contexts that do no harm. To do this successfully requires more than a mere avoidance of overt bigotry; rather, we must be mindful of implicit bias, microaggressions, and the potential for generalized and algorithmic analysis to amplify systemic bias, both implicit and overt.
-
Jason Ludwig, Kendall Darfler, Kristene Unsworth, and Kelly Joyce. “An Algorithm Discriminates.” Online Ethics Center for Engineering, 11/28/2017. ↩
Design Questions to Help You Begin
Please answer the following questions in your README file before you begin writing your program.- On paper, read the first four lines of the Iris CSV file where the flower is Setosa, where the flower is Virginica, and where the flower is Versicolor. Still on paper, group the numbers into three separate lists, according to the flower species. What is the average sepal length of the Virginica flowers?
- What functions would you write to help you to solve this problem?
- What classes do you suggest to organize your data?
Submission
In your submission, please include answers to any questions asked on the assignment page in your README file. If you wrote code as part of this assignment, please describe your design, approach, and implementation in your README file as well. Finally, include answers to the following questions:- Describe what you did, how you did it, what challenges you encountered, and how you solved them.
- Please answer any questions found throughout the narrative of this assignment.
- If collaboration with a buddy was permitted, did you work with a buddy on this assignment? If so, who? If not, do you certify that this submission represents your own original work?
- Please identify any and all portions of your submission that were not originally written by you (for example, code originally written by your buddy, or anything taken or adapted from a non-classroom resource). It is always OK to use your textbook and instructor notes; however, you are certifying that any portions not designated as coming from an outside person or source are your own original work.
- Approximately how many hours it took you to finish this assignment (I will not judge you for this at all...I am simply using it to gauge if the assignments are too easy or hard)?
- Your overall impression of the assignment. Did you love it, hate it, or were you neutral? One word answers are fine, but if you have any suggestions for the future let me know.
- Any other concerns that you have. For instance, if you have a bug that you were unable to solve but you made progress, write that here. The more you articulate the problem the more partial credit you will receive (it is fine to leave this blank).
Assignment Rubric
| Description | Pre-Emerging (< 50%) | Beginning (50%) | Progressing (85%) | Proficient (100%) |
|---|---|---|---|---|
| Algorithm Implementation (60%) | The algorithm fails on the test inputs due to major issues, or the program fails to compile and/or run | The algorithm fails on the test inputs due to one or more minor issues | The algorithm is implemented to solve the problem correctly according to given test inputs, but would fail if executed in a general case due to a minor issue or omission in the algorithm design or implementation | A reasonable algorithm is implemented to solve the problem which correctly solves the problem according to the given test inputs, and would be reasonably expected to solve the problem in the general case |
| Code Quality and Documentation (30%) | Code commenting and structure are absent, or code structure departs significantly from best practice, and/or the code departs significantly from the style guide | Code commenting and structure is limited in ways that reduce the readability of the program, and/or there are minor departures from the style guide | Code documentation is present that re-states the explicit code definitions, and/or code is written that mostly adheres to the style guide | Code is documented at non-trivial points in a manner that enhances the readability of the program, and code is written according to the style guide, and each function contains relevant and appropriate Javadoc documentation |
| Writeup and Submission (10%) | An incomplete submission is provided | The program is submitted, but not according to the directions in one or more ways (for example, because it is lacking a readme writeup or missing answers to written questions) | The program is submitted according to the directions with a minor omission or correction needed, including a readme writeup describing the solution and answering nearly all questions posed in the instructions | The program is submitted according to the directions, including a readme writeup describing the solution and answering all questions posed in the instructions |
Please refer to the Style Guide for code quality examples and guidelines.