CS170: Programming for the World Around Us - Respiratory Tracker (100 Points)
Contents
Assignment Goals
The goals of this assignment are:
- To design computing solutions to math and scientific through numeric processing
- To use lists to store and analyze data
- To create parallel arrays to represent associated data
- To iterate over lists of data
- To smooth and filter noisy signal data prior to analysis
The Assignment
Take a deep breath - inhale, and exhale! It’s nice when a homework assignment starts out that way. Could you feel your shoulders rise and fall like a wave? Indeed, our respiratory patterns are sinusoidal. In, and out; up, and down; over and over again. Count how many breaths you take in a minute. How did you do it? Chances are, you counted once for every inhale, or once for every exhale, over 60 seconds. Your breathing might have sped up and slowed down during that time, but in general, you have an idea of how many “breaths per minute” you took.
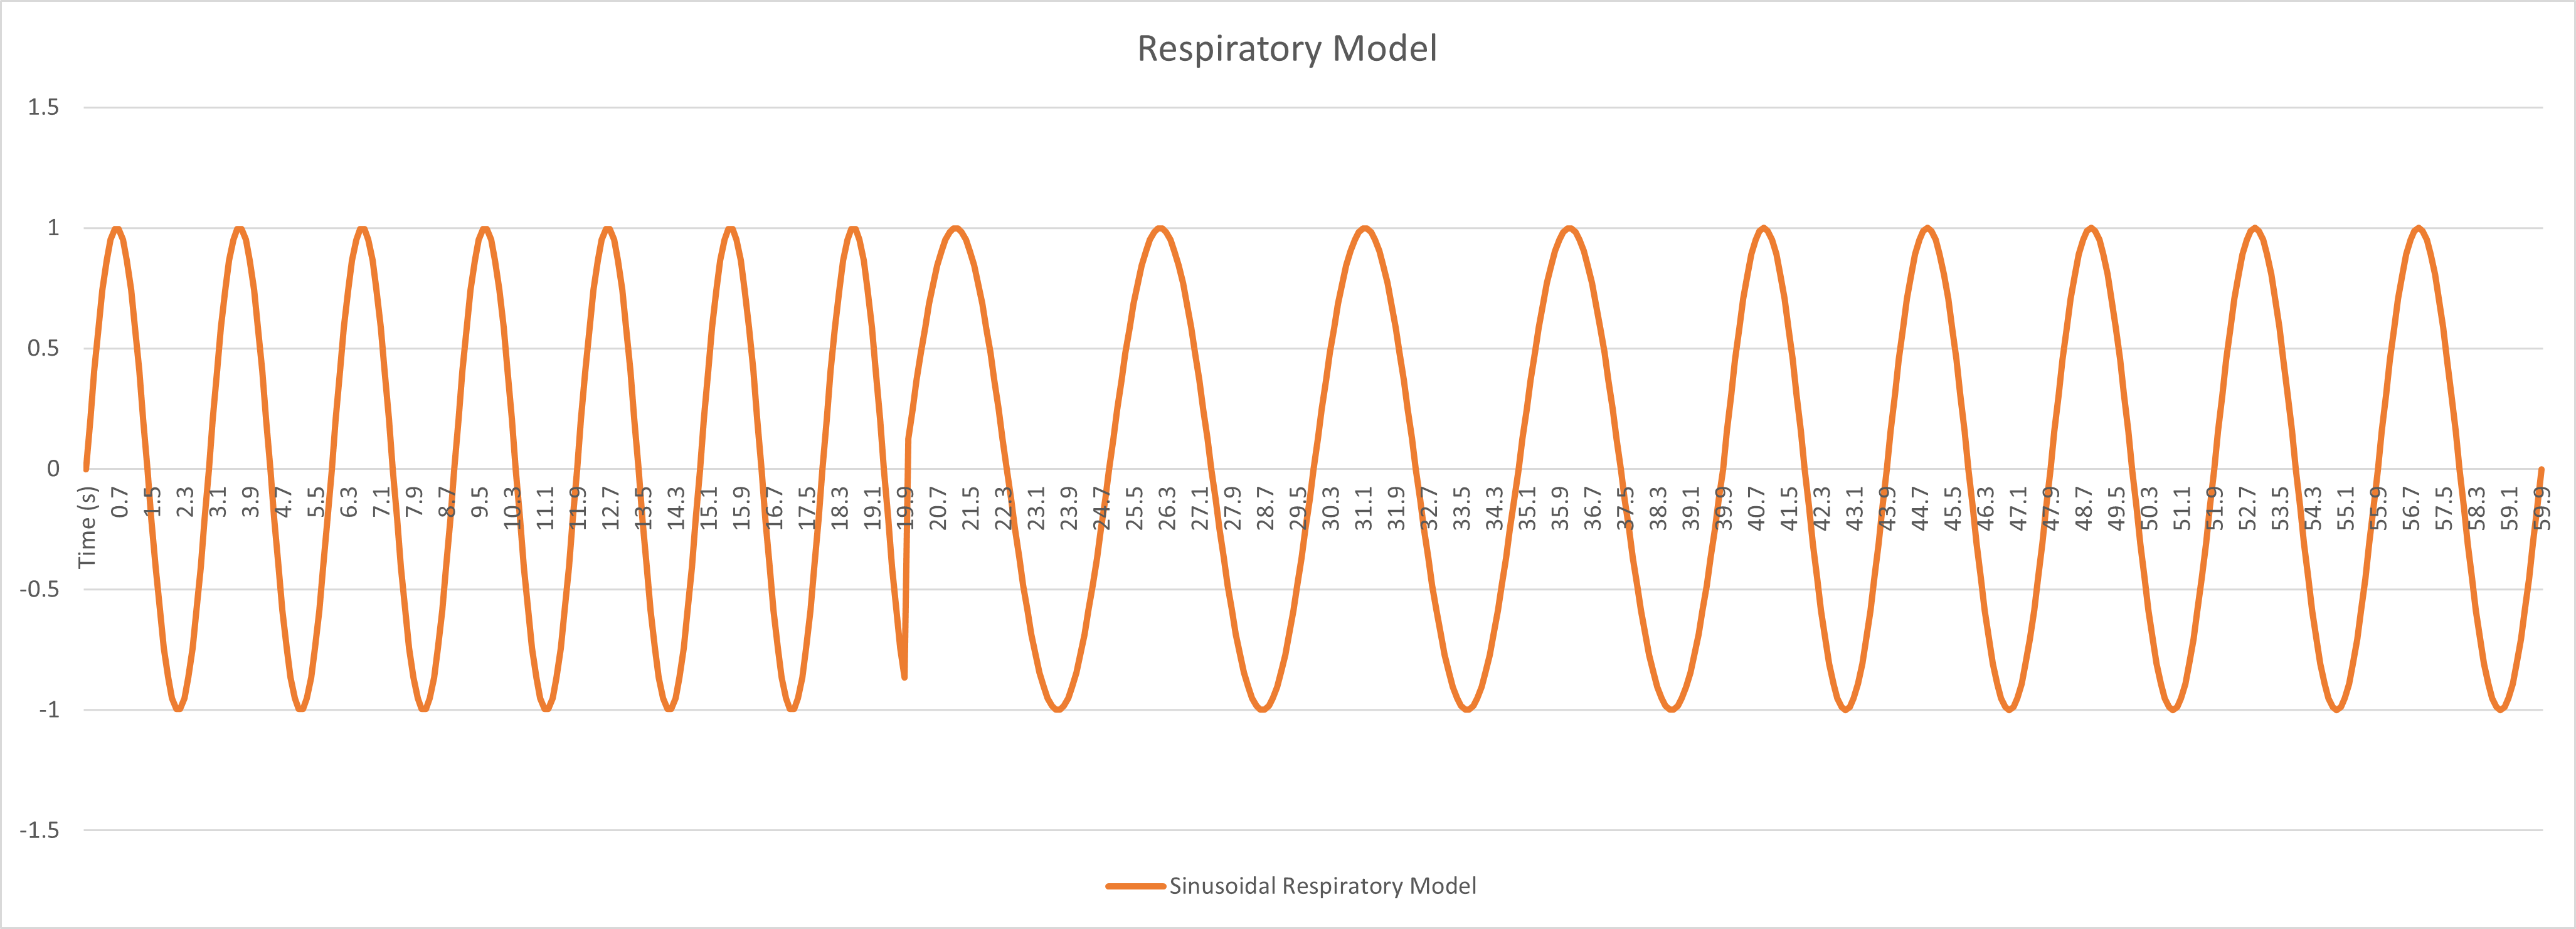
In this assignment we’ll write a computer program to track one’s respiratory rate by analyzing a graph of their chest wall movement. We will model this movement as a sine wave, such as the one below:
This is a real problem! Hospital respiratory monitors, smart watches, and even smart fabric shirts estimate breathing rate from exactly this kind of wavy, noisy sensor signal — and they all face the same challenge you will face here: real signals wiggle, and a program that is fooled by every wiggle will count far too many breaths. By the end of this assignment you will have written a small but genuine piece of biomedical signal processing.
Getting Started with GitHub
Accept the assignment invitation link and clone your repository to your computer (see the course modules on Using Git and GitHub and GitHub Classroom if you’d like a refresher). As you complete each step below, git add, git commit, and git push — your latest pushed commit is what is graded, and committing after each working step gives you a safety checkpoint to return to.
What to Do
Download this file containing time and a sinusoidal model of chest wall rise. Add it to your project. This is a “comma separated file,” meaning that each line contains the time and the value, in this format:
T,Y
0.1,-0.9
0.2,-0.8
0.3,-0.7
Each line contains the time (in seconds), followed by a comma, followed by the value at that time. The first line is called the “header” line and it contains the titles (T for time and Y for the value). We’ll skip that line when we process, since it’s not numeric data (it’s just there as a convenience for the human, to remember what order the data is in!).
This particular file represents breathing at a rate of 20 breaths per minute (BPM) for 20 seconds, followed by a respiratory rate of 12 BPM for 20 seconds, followed by a respiratory rate of 15 BPM for 20 seconds. That means you already know the answers your program should produce — a luxury that real programmers create for themselves all the time by testing on data with a known answer first!
Reading the File
You could open this file and process it in pure Python:
f = open("respiratoryexample.csv")
for line in f: # read each line
    data = line.split(",") # split the data up by the comma into its two parts
    time = data[0] # time is first
    y = data[1] # the sinusoidal value is second
However, there is a convenience library called csv for “comma separated values” that does some of the work for you. Begin by importing the csv library, and you can do this instead:
f = open('respiratoryexample.csv')
csvfile = csv.reader(f)
for row in csvfile:
    time = row[0]
    y = row[1]
This doesn’t look like much of a savings at first, but sometimes CSV files contain commas in the data, or have other formatting considerations, that the library takes care of automatically. You may choose either approach.
Skipping the Header Row
Next, add a variable to track how many rows you have read. Increment it each time through the loop. Only extract the time and y values if this is not the header row.
Converting the Values to Numeric Variables
You can convert your time and y values to numeric variables using the float function, for example:
time = float(time)
Reading the Data into a List
Create two list variables to hold the times and the y values; within your loop as you read the file row-by-row, append the time and the y value to your lists. They will have the same length, and each item in one list corresponds to the item at the same position in the other. This is called a set of “parallel arrays.”
Commit checkpoint: once you can print the first few times and y values, git commit and git push!
Detecting Breaths: Why the Obvious Approach Fails
A breath shows up in our data as a peak: the chest rises, tops out, and falls. If we can find the position of every peak, then the time between neighboring peaks is the length of one breath, and we can turn that into breaths per minute.
The obvious way to find a peak is to look for any point that is bigger than both of its neighbors. Let’s see why that isn’t good enough. Real breathing signals are noisy — the sensor jitters, the person shifts in their chair — so the graph wiggles a little on its way up and down. Consider this small series of y values, sampled 10 times per second, where a person takes one breath:
| index | 0 | 1 | 2 | 3 | 4 | 5 | 6 | 7 | 8 | 9 |
|---|---|---|---|---|---|---|---|---|---|---|
| y | 0.0 | 0.4 | 0.3 | 0.8 | 1.0 | 0.7 | 0.9 | 0.5 | 0.1 | -0.2 |
Scan along and apply the “bigger than both neighbors” rule:
- Index 1 (0.4) is bigger than 0.0 and 0.3 — counted as a peak!
- Index 4 (1.0) is bigger than 0.8 and 0.7 — counted as a peak!
- Index 6 (0.9) is bigger than 0.7 and 0.5 — counted as a peak!
Three “breaths” in one second of data — that’s 180 BPM, when the true answer is one breath. The little wiggles at indices 1 and 6 are just noise on the way up and down the real peak at index 4. A hospital monitor that triple-counted breaths would be worse than useless.
In your README: explain in your own words why the naive neighbor-comparison approach over-counts breaths on noisy data.
We’ll defeat the noise with a three-step algorithm used (in fancier forms) by real signal-processing software:
- Smooth the signal with a moving average, so tiny wiggles average away.
- Find local maxima in the smoothed signal.
- Filter the candidate peaks, keeping only those that are tall enough (a height threshold) and far enough apart (a minimum spacing).
Step 1: Smooth the Signal with a Moving Average
A moving average replaces each value with the average of a small window of values around it. Averaging cancels out small random wiggles (some are a little high, some a little low) while preserving the big slow shape of the breath.
With a window size of 3, the smoothed value at index i is the average of the values at i-1, i, and i+1. Let’s compute it for the noisy series above (rounding to two decimals):
| index | window values | smoothed value |
|---|---|---|
| 1 | (0.0 + 0.4 + 0.3) / 3 | 0.23 |
| 2 | (0.4 + 0.3 + 0.8) / 3 | 0.50 |
| 3 | (0.3 + 0.8 + 1.0) / 3 | 0.70 |
| 4 | (0.8 + 1.0 + 0.7) / 3 | 0.83 |
| 5 | (1.0 + 0.7 + 0.9) / 3 | 0.87 |
| 6 | (0.7 + 0.9 + 0.5) / 3 | 0.70 |
| 7 | (0.9 + 0.5 + 0.1) / 3 | 0.50 |
| 8 | (0.5 + 0.1 + (-0.2)) / 3 | 0.13 |
Look at the smoothed column: it rises steadily to a single hump at index 5 and falls away. The fake peaks at indices 1 and 6 are gone! (The exact top shifted from index 4 to index 5 — a small price to pay, and one reason the timestamps we compute are estimates.)
Two details to decide in your implementation:
- The ends of the list. Index 0 has no left neighbor and the last index has no right neighbor, so a full window doesn’t fit there. The simplest correct choice is to only compute smoothed values where the whole window fits (so your smoothed list is a bit shorter, starting at index
window // 2). Just remember the offset when you convert a smoothed index back to a time! Averaging “whatever part of the window fits” is also acceptable — describe your choice in your README. - The window size. Our file has 10 samples per second. A window of 5 samples averages over half a second — long enough to erase jitter, short enough not to blur two breaths together. Make it a named constant like
WINDOW_SIZEand experiment.
In your README: what happens if the window is too big — say, 100 samples (10 seconds)? Try it and describe what your program reports.
Step 2: Find Local Maxima in the Smoothed Signal
Now the neighbor rule works: loop over the smoothed list, and record index i as a candidate peak whenever
smooth[i] > smooth[i - 1] and smooth[i] >= smooth[i + 1]
(The >= on one side handles small flat tops, where two equal values sit at the summit.) Collect the candidate indices in a list.
Step 3: Filter the Candidates by Height and Spacing
Smoothing removes most noise, but two safety filters make the detector robust — this is what separates a toy from an instrument:
- Height threshold: a genuine inhale rises well above the middle of the signal. Compute the midpoint
threshold = (max(smooth) + min(smooth)) / 2and reject any candidate whose smoothed value is below it. This discards leftover ripples near the bottom of the wave. (This is a simple form of what signal-processing folks call prominence — demanding that a peak stand tall over its surroundings.) - Minimum spacing: even a fast breather rarely exceeds one breath per second, so two true peaks can’t be 3 samples apart. Walk through your candidates in order and accept a candidate only if it is at least
MIN_SPACINGsamples after the last accepted peak (with 10 samples per second,MIN_SPACING = 10— one second — is a sensible floor). In medicine and electronics this waiting time is called a refractory period.
In your README: give one situation where the height threshold rejects a false peak that the spacing filter would miss, and one where the spacing filter rejects a false peak that the height threshold would miss.
Step 4: Compute the Respiratory Rate
Now your accepted peaks mark one inhale each, so the gap between neighboring accepted peaks is one full breath — no doubling needed. For each pair of neighboring accepted peak indices, the difference delta is measured in samples. Our file samples 10 rows per second (SAMPLE_RATE = 10), so:
seconds per breath = delta / SAMPLE_RATE
breaths per minute = 60 / (delta / SAMPLE_RATE) = 60 * SAMPLE_RATE / delta
For example, a 20 BPM breather breathes every 3 seconds, which is 30 samples: 60 * 10 / 30 = 20 BPM. Check! Print the estimated BPM at each breath (you may also print the time at which it occurred, using your parallel times list). You can compute the deltas with a loop that remembers the previous accepted peak, or by handing your list of accepted peak indices to numpy’s np.diff(), which returns the differences between neighboring values as a new list.
In your README: at the boundaries where the respiratory rate changes (20 seconds and 40 seconds in), your estimate will be briefly “in between” the two rates. Why?
Alerting
Respiratory monitors should alert if the respiratory rate goes too low or too high. If the respiratory rate drops below 15 (an arbitrary non-medical limit, just for experimentation!), print a warning to the screen. With the sample file, you should see alerts during the middle (12 BPM) section only.
Program Structure
Your final program might look something like this — you are welcome to use this scaffold directly:
"""Respiratory rate tracker: estimates breaths per minute from chest wall data."""
import csv

SAMPLE_RATE = 10   # samples per second in the data file
WINDOW_SIZE = 5    # moving average window, in samples
MIN_SPACING = 10   # accepted peaks must be at least this many samples apart
LOW_RATE_ALERT = 15  # alert if BPM falls below this


def moving_average(values, window):
    """Return a new list of the window-sized moving average of values.

    The result is shorter than values, because the smoothed series
    starts where a full window first fits (offset window // 2).
    """
    smoothed = []
    # TODO: loop so that a full window fits at each position:
    #   for each valid center position, sum the window values,
    #   divide by window, and append to smoothed
    return smoothed


def find_peaks(values, threshold, min_spacing):
    """Return a list of indices of peaks in values.

    A peak is a local maximum (bigger than its left neighbor,
    at least as big as its right neighbor) whose value is at
    least threshold, and which is at least min_spacing samples
    after the previously accepted peak.
    """
    peaks = []
    # TODO: loop from 1 to len(values) - 1:
    #   1) check the local maximum condition
    #   2) check values[i] >= threshold
    #   3) check i is at least min_spacing after the last accepted peak
    #      (careful: compare against the last ACCEPTED peak, not the
    #       last candidate!)
    return peaks


# TODO: read the CSV file into parallel lists: times and ys
#   - skip the header row
#   - convert each value with float() before appending

# TODO: smooth the ys with moving_average(ys, WINDOW_SIZE)

# TODO: compute the threshold from the smoothed values:
#   threshold = (max(smoothed) + min(smoothed)) / 2

# TODO: call find_peaks(smoothed, threshold, MIN_SPACING)

# TODO: for each pair of neighboring peak indices, compute
#   delta (in samples) and bpm = 60 * SAMPLE_RATE / delta;
#   print the bpm (and, if you like, the time it occurred,
#   remembering the smoothing offset of WINDOW_SIZE // 2)

# TODO: if bpm < LOW_RATE_ALERT, print an alert
Test each function as you write it! For example, before touching the real file, try:
print(moving_average([0.0, 0.4, 0.3, 0.8, 1.0, 0.7, 0.9, 0.5, 0.1, -0.2], 3))
and check the output against the worked table above. Then try find_peaks on that smoothed list and confirm it finds exactly one peak. This is exactly how the graders will reason about your code, and exactly how professionals build confidence in theirs.
Code Quality
Your Code Quality score is informed by pylint: see the Code Quality and Linting module for how to install it, run it (pylint yourprogram.py), and read its output. Named constants like SAMPLE_RATE, snake_case variable names, and docstrings on your two functions will get you most of the way there.
What to Turn In
When you’re done, write a README.md for your project in your repository, and commit and push all of your files to GitHub; your latest pushed commit is your submission. In your README, answer any bolded questions presented on this page. In addition, write a few paragraphs describing what you did, how you did it, and how to use your program — including the window size, threshold, and minimum spacing you settled on, and why. Imagine that you are giving your program to another student in the class, and you want to explain to them how to use it. What would you tell them? Imagine also that another student had given you the functions that you wrote for your program: what would you have wished that you knew about how to call those functions?
Before You Submit: Self-Check
- My program runs top-to-bottom without errors with
respiratoryexample.csvin the same folder. moving_averagereturns the values in the worked example table above when given the example list and window 3.find_peaksfinds exactly one peak in the worked example’s smoothed data.- On the sample file, my program reports approximately 20, then 12, then 15 BPM — with no hard-coded answers.
- The low-rate alert prints during the 12 BPM section, and only there.
SAMPLE_RATE,WINDOW_SIZE,MIN_SPACING, and the alert limit are named constants, not magic numbers.- I ran
pylintand fixed the warnings I understand (and asked about the ones I don’t). - Both functions have docstrings stating purpose, inputs, and return value.
- My
README.mdanswers every bolded question on this page and explains how to run the program. - I committed AND pushed, and my final version (code, CSV, and README) is visible on github.com.
Submission
In your submission, please include answers to any questions asked on the assignment page, as well as the questions listed below, in your README file.
If you wrote code as part of this assignment, please describe your design, approach, and implementation in a separate document prepared using a word processor or typesetting program such as LaTeX. This document should include specific instructions on how to build and run your code, and a description of each code module or function that you created suitable for re-use by a colleague.
In your README, please include answers to the following questions:
- Describe what you did, how you did it, what challenges you encountered, and how you solved them.
- Please answer any questions found throughout the narrative of this assignment.
- If collaboration with a buddy was permitted, did you work with a buddy on this assignment? If so, who? If not, do you certify that this submission represents your own original work?
- Please identify any and all portions of your submission that were not originally written by you (for example, code originally written by your buddy, or anything taken or adapted from a non-classroom resource). It is always OK to use your textbook and instructor notes; however, you are certifying that any portions not designated as coming from an outside person or source are your own original work.
- Approximately how many hours it took you to finish this assignment (I will not judge you for this at all...I am simply using it to gauge if the assignments are too easy or hard)?
- Your overall impression of the assignment. Did you love it, hate it, or were you neutral? One word answers are fine, but if you have any suggestions for the future let me know.
- Using the grading specifications on this page, discuss briefly the grade you would give yourself and why. Discuss each item in the grading specification.
- Any other concerns that you have. For instance, if you have a bug that you were unable to solve but you made progress, write that here. The more you articulate the problem the more partial credit you will receive (it is fine to leave this blank).
- Please describe any use of outside resources you may have engaged in the completion of this assignment, including the use of generative Artificial Intelligence.
Assignment Rubric
| Description | Pre-Emerging (< 50%) | Beginning (50%) | Progressing (85%) | Proficient (100%) |
|---|---|---|---|---|
| Algorithm Implementation (60%) | The program fails to run, or one or more core components (file reading into parallel lists, moving average smoothing, peak detection with threshold and spacing filters, BPM computation) is absent or does not execute | The program runs and reads the CSV into parallel lists, but the smoothing or peak detection contains a logic error (for example, an incorrect window average, a missing threshold or spacing check, or an off-by-one) that produces a clearly incorrect breath count on the provided sample file | The program reports approximately correct BPM values (near 20, 12, and 15 for the three segments of the provided sample file), but one component would fail in a more general case; for example, the moving average mishandles the ends of the list, the minimum-spacing filter is hard-coded to this file's peak positions, or the low-rate alert does not trigger correctly at the 12 BPM segment | All components are correctly implemented and clearly separated (functions for smoothing and peak finding): the CSV is read into parallel time and y lists skipping the header, the moving average is computed correctly for the chosen window size, local maxima are detected and filtered by both a height threshold and a minimum spacing, the reported BPM values are approximately 20, 12, and 15 for the three segments of the sample file with no hard-coded answers, and the low-rate alert triggers during the 12 BPM segment |
| Code Indentation and Spacing (10%) | Indentation is inconsistent enough that the program's structure cannot be followed, or the program fails to run due to indentation errors | Indentation runs, but block structure is misleading in places (for example, statements indented as if inside a loop or function when they are not), or spacing around operators and functions is haphazard | Indentation is correct and consistent (4 spaces per level) with only isolated lapses in blank-line or operator spacing | Indentation is correct and consistent (4 spaces per level), functions are separated by blank lines, and spacing makes each loop and conditional easy to follow at a glance |
| Code Quality (10%) | The code does not reflect course style standards: names like x, a, and data2 dominate, dead or duplicated code remains, and pylint reports numerous unaddressed errors and warnings | Some names are descriptive and some duplication is factored into functions, but pylint reports several unaddressed warnings (for example unused variables or non-snake_case names) that were flagged on prior assignments | Names are descriptive snake_case, constants like SAMPLE_RATE and WINDOW_SIZE are named rather than sprinkled as magic numbers, and only a few minor pylint conventions (for example a long line or missing docstring) remain | Code runs cleanly through pylint aside from any findings the instructor has designated acceptable: descriptive snake_case names, named constants for the sample rate, window size, threshold, and minimum spacing, no unused variables, and no duplicated logic that a function could remove |
| Code Documentation (10%) | Comments and docstrings are absent, or comments contradict what the code actually does | Some comments are present, but moving_average or find_peaks lacks a docstring describing its inputs and return value | Every function has a docstring or comment stating its purpose, inputs, and return value, but non-obvious steps (for example why the threshold uses the midpoint of min and max, or why the spacing filter exists) are uncommented | Every function has a docstring stating purpose, inputs, and return value, and comments at non-trivial points explain why (for example, why the peaks must be at least MIN_SPACING samples apart), enhancing rather than restating the code |
| Writeup and Submission (10%) | No repository was pushed, or the pushed repository is missing the program or has a blank README | The repository is pushed but the README is missing answers to one or more of the bolded questions, or does not describe how to run the program | The repository is pushed with a README that describes the solution and how to run it and answers nearly all bolded questions, with a minor omission or correction needed | The final version is pushed to GitHub before the deadline with a README that explains how to run the program, describes the smoothing and peak detection approach and the window, threshold, and spacing values chosen (and why), and answers every bolded question on this page |
Please refer to the Style Guide for code quality examples and guidelines.